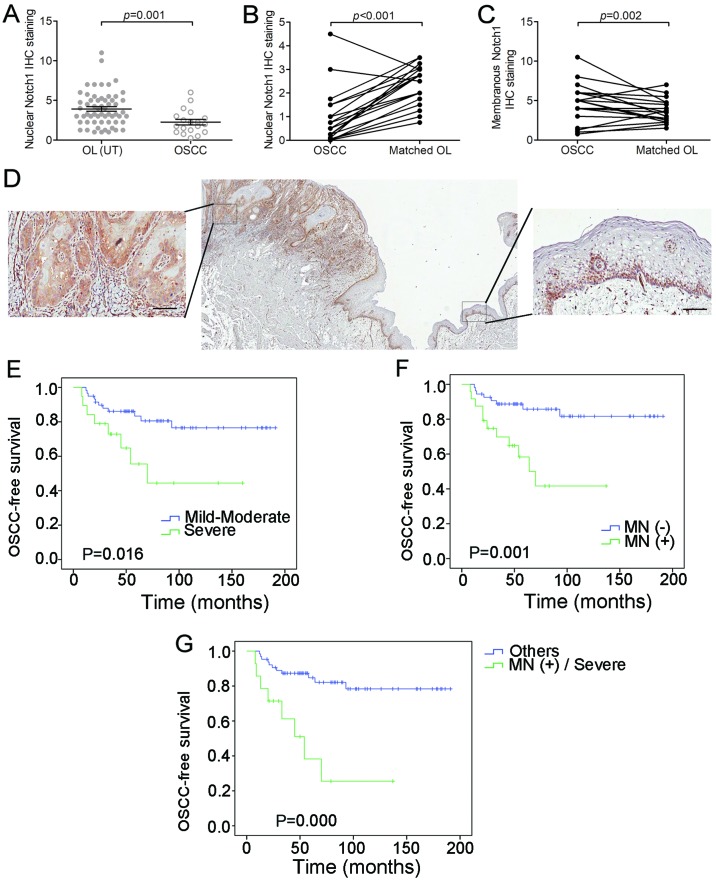
Figure 4.
Immunohistochemistry (IHC) staining of membranous and nuclear Notch1 in OL and OSCC specimens. (A) Comparison between 59 untransformed (UT) OL samples and 19 OSCC samples in terms of nuclear Notch1 expression. Nuclear Notch1 expression scores were higher in untransformed (UT) OLs than OSCCs (P=0.001). (B) Nuclear Notch1 expression was decreased in OLs compared to their transformed OSCCs (P<0.001). (C) Membranous Notch1 expression was increased in OLs compared to their transformed OSCCs (P=0.002). (D) Representative images of samples that revealed decreased expression of nuclear Notch1 and increased expression of membranous Notch1 in cancer nests than in the adjacent non-cancerous epithelium. (E) Association of dysplasia grade with OSCC-free survival (P=0.016). (F) Association of membranous Notch1 (MN) with OSCC-free survival (P=0.001). (G) Combination of dysplasia grade and MN with OSCC-free survival (P=0.000). Scale bar, 100 µm.

