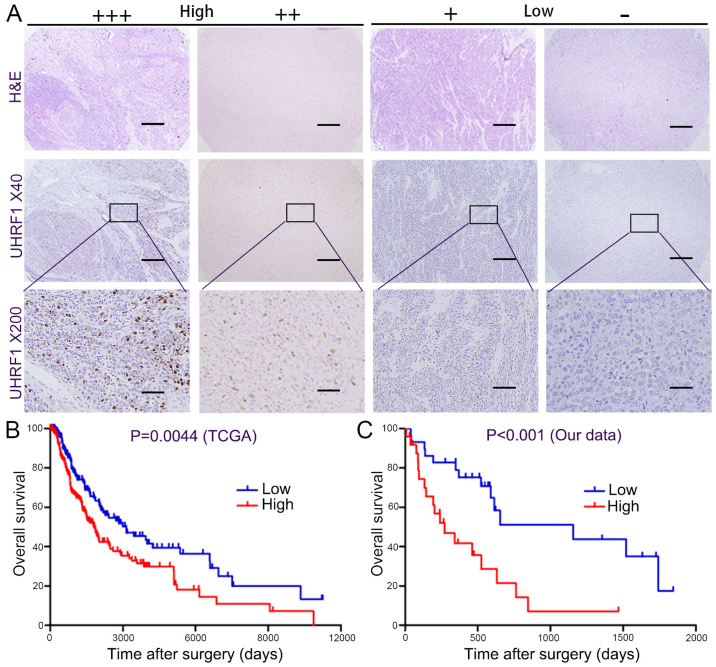
Figure 4.
The expression of UHRF1 is correlated with overall survival time. (A) Representative images of UHRF1 expression are shown; +++/++ were classified as high expression and +/- were classified as low expression. Scale bar, 50 µm. (B) Patients with a high level of UHRF1 had a lower OS than those with low UHRF1 expression by reexamining the TCGA dataset. (C) Patients with a high level of UHRF1 had a lower OS than those with low UHRF1 expression in our melanoma cohort. OS, overall survival.

