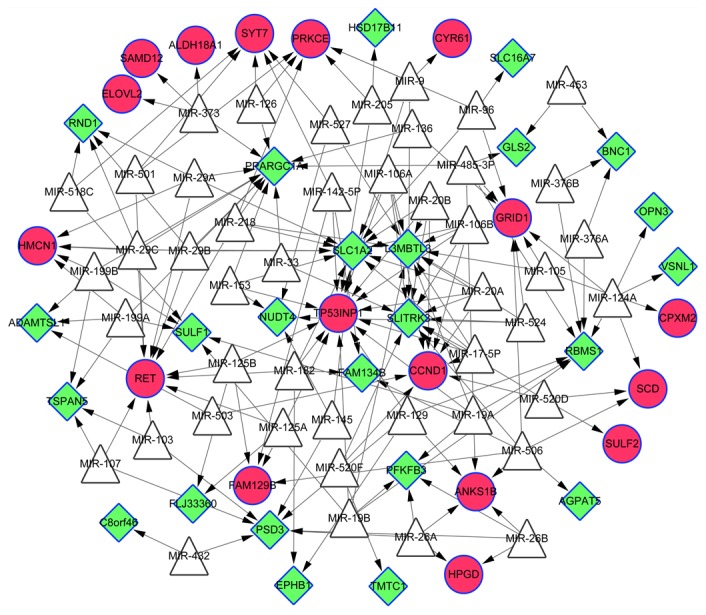
Figure 4.

MicroRNA target network. White triangle nodes represent the predicted microRNAs. The red cycle nodes represent upregulated genes and the green diamond nodes represent downregulated genes. Overlapping genes between the differentially-expressed and -methylated genes are indicated by surrounding blue borders.
