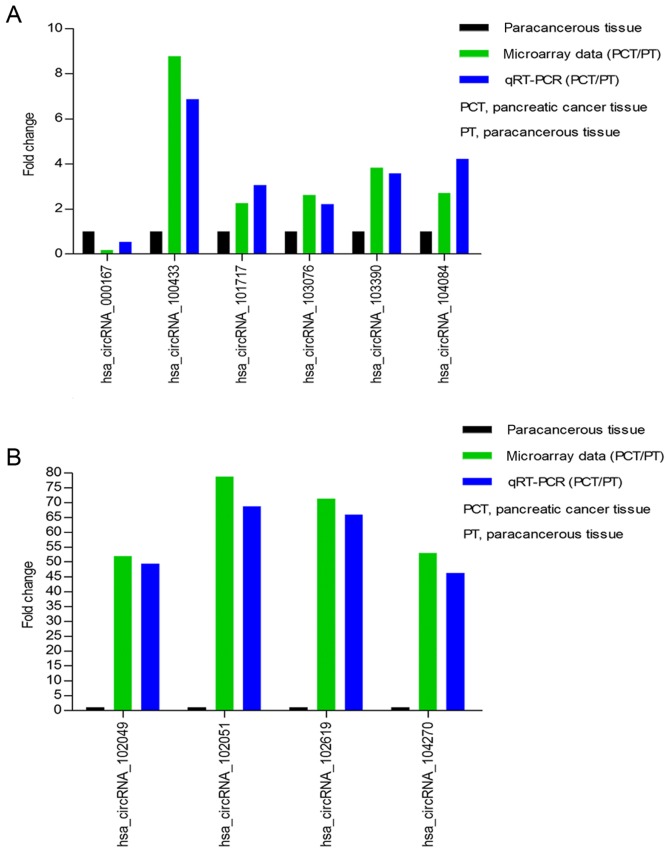
Figure 3.
Validation for circRNAs expression. (A and B) The expression levels of ten circRNAs are validated by RT-qPCR in 10 pancreatic cancer tissues and corresponding paracancerous tissues. The data are presented as mean ± SD. The comparison is performed between microarray data and RT-qPCR results. The y-axis in the diagram represents the mean of fold-change (log2 transformed) of each circRNA measured by RT-qPCR and microarray respectively. The RT-qPCR results are consistent with microarray data. RT-qPCR, reverse transcription-quantitative polymerase chain reaction; circRNA, circular RNA; PCT, pancreatic cancer tissue; PT, paracancerous tissue.

