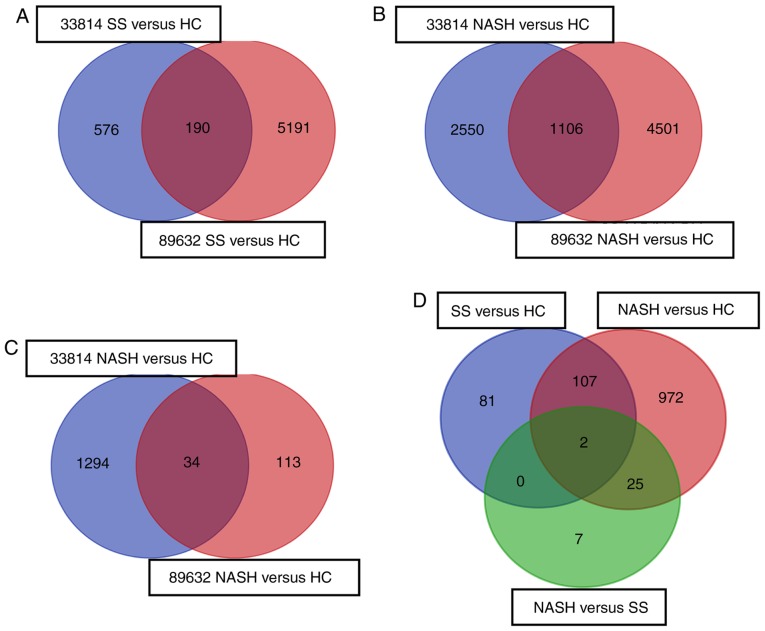
Figure 1.
DEGs were identified in the mRNA expression profiles GSE33814 and GSE89632. The DEGs in different comparison groups were selected using a Venn diagram. DEGs were compared in the (A) SS vs. HC group, (B) NASH vs. HC group, (C) NASH vs. SS group and (D) between the three comparison groups. DEG, differentially expressed gene; SS, steatosis; HC, healthy control; NASH, non-alcoholic steatohepatitis.

