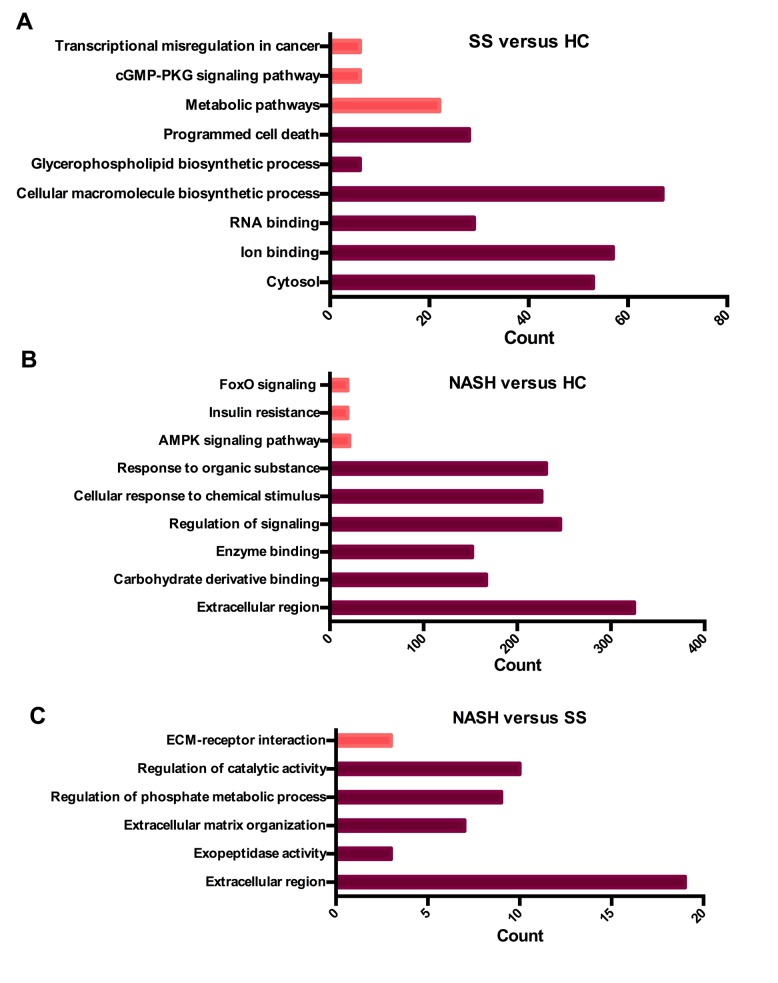
Figure 2.
Summary of the top GO and KEGG results of DEGs. (A) Results of SS vs. HC group. (B) Results of NASH vs. HC group. (C) Results of NASH vs. SS group. The count represents the number of genes that enriched in one GO or KEGG term. The deep red bars represent GO in terms of DEGs. The light red bars represent KEGG in terms of DEGs. DEG, differentially expressed gene; SS, steatosis; HC, healthy control; NASH, non-alcoholic steatohepatitis; KEGG, Kyoto Encyclopedia of Genes and Genomes; GO, gene ontology; ECM, extracellular matrix; FoxoO, Forkhead box protein O1; cGMP-PKG; cyclic guanine monophosphate-dependent protein kinase, isozyme 1; AMPK, 5′-AMP-activated protein kinase.

