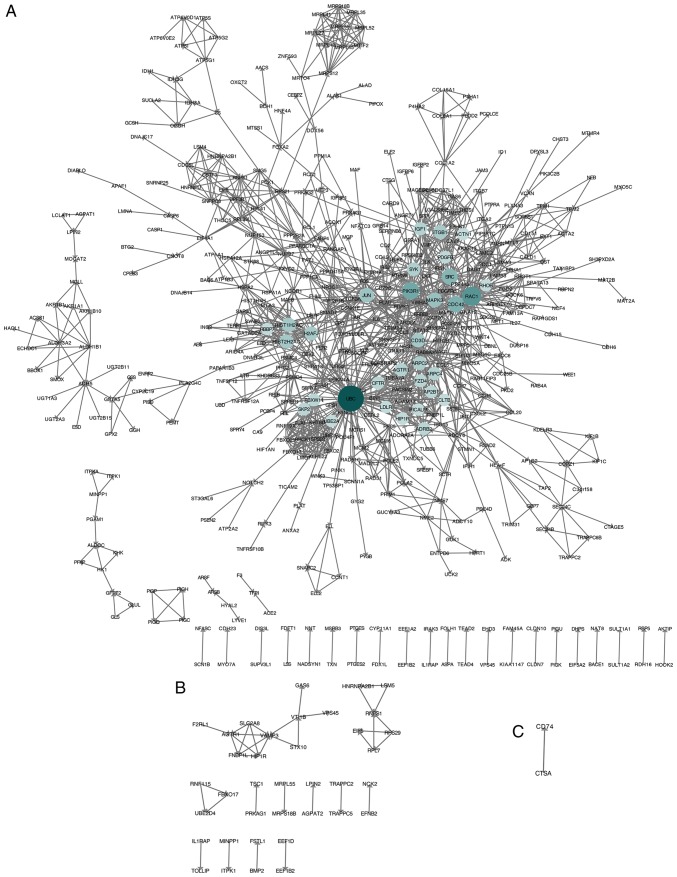
Figure 3.
PPI network of identified DEGs constructed using Cytoscape software. (A) DEGs in the NASH vs. HC group. (B) DEGs in the SS vs. HC group. (C) DEGs in the NASH vs. SS group. The size and color depth of nodes represent the degree of one gene. The degree of one gene means the number of its interactions with other genes. The higher the degree of one gene, the more important it is in the PPI network. The edges represent the relationship between genes. DEG, differentially expressed gene; SS, steatosis; HC, healthy control; NASH, non-alcoholic steatohepatitis.

