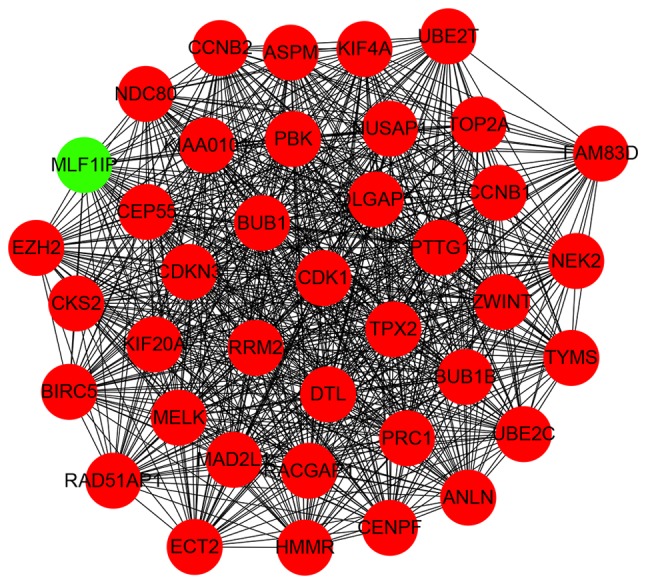
Figure 6.

MCODE identification of the most significantly enriched module. The module with the highest MCODE score was selected from the protein-protein interaction network. Green indicates the downregulated genes and red indicates the upregulated genes.
