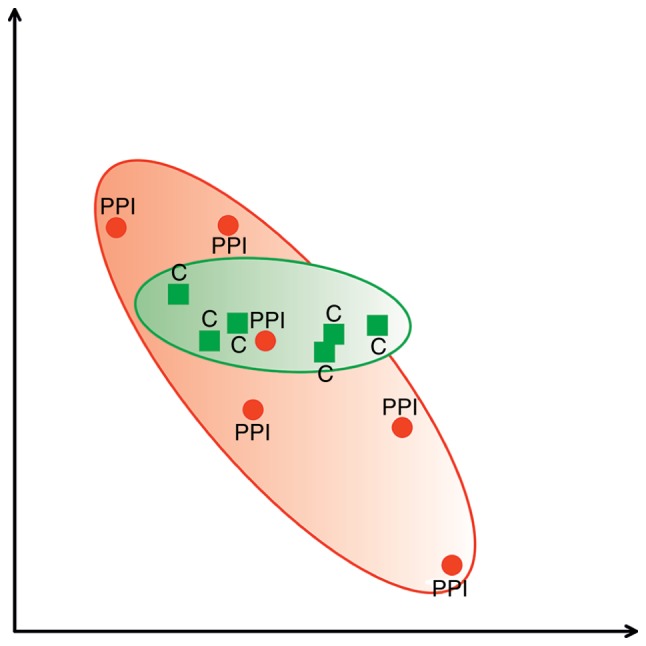
Figure 2.

PCA scatterplot presenting analysis of spots from PPI group (red area) and C group (green area). Statistical analysis of association between spots obtained from examined groups of patients (PCA 3D) (15). The range of overlapping areas represent the differences between examined groups of patients. The picture was created by Delta2D software based on statistical analysis (15). C, control; PPI, partus praematurus imminens; PCA, principal components analysis.
