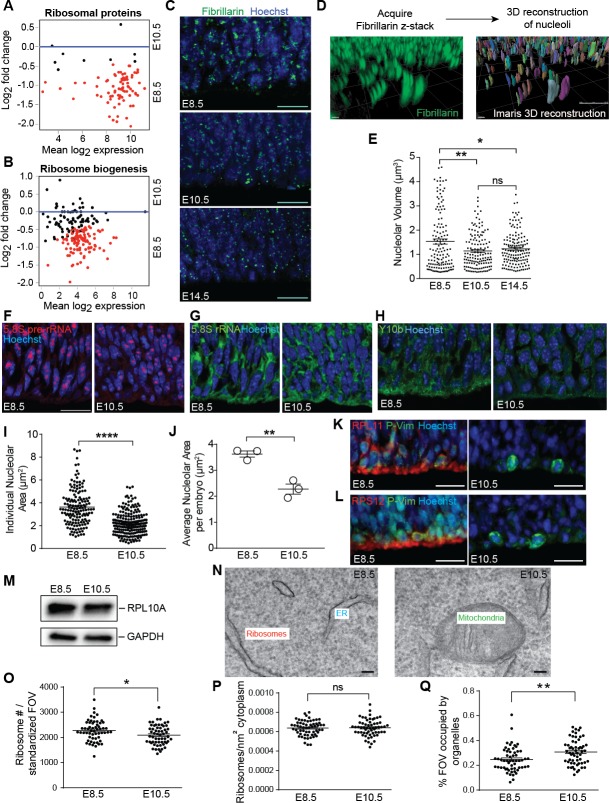
Figure 2. Ribosome biogenesis decreases from E8.5 to E10.5.
(A, B) MA plot displaying genes encoding ribosomal proteins (A), ribosome biogenesis factors (B). Each dot represents a single gene. Red dots denote differentially expressed genes as identified by Cuffdiff (q < 0.05). Genes below blue line (y = 0) are enriched in E8.5. (C) Immunohistochemistry of the nucleolar protein Fibrillarin (green) in E8.5, E10.5 and E14.5 neuroepithelium. Scale bar = 20 μm. (D) Example of z-stack image of Fibrillarin staining (left) and 3D reconstruction of nucleoli using Imaris (right). (E) Quantification of nucleolar volume using Imaris. Each data point represents one nucleolus. *p≤0.05, **p≤0.01, Welch’s ANOVA with Games-Howell post-hoc test. Sample size, E8.5: n = 135 from three embryos; E10.5: n = 139 from three embryos; E14.5: n = 146 from three embryos. (F, G) Representative images of fluorescent in situ hybridization of 5.8S pre-rRNA (F, red) and 5.8S total rRNA (G, green). (H) Y10b immunostaining shows higher levels of 5.8S rRNA in E8.5 than E10.5 neuroepithelium. Scale bar = 20 μm. (I) Quantification of 5.8S pre-rRNA signal shows larger nucleolar area in E8.5 compared to E10.5 neuroepithelium. Each data point represents one nucleolus. ****p≤0.0001, Welch’s t-test. Sample size, E8.5: n = 150 from three embryos; E10.5: n = 202 from three embryos. (J) Average nucleolar area in E8.5 vs. E10.5 embryo. **p≤0.01, unpaired t-test, n = 3 embryos. (K, L) RPL11 (K, red) and RPS12 (L, red) were more highly expressed along the apical surface of E8.5 than E10.5 neuroepithelium. Phospho-Vimentin (P-Vim, green) labels dividing progenitors. Scale bar = 20 μm. (M) Immuoblotting shows similar expression of RPL10A between E8.5 and E10.5. (N) Representative images of TEM in neuroepithelial cells at E8.5 and R10.5. (O–Q) Quantification of TEM ribosomal number per standardized field of view (FOV), 78,736 nm2, (O), ribosomal density in cytoplasm (P), and percent of the standard FOV occupied by membrane-bound organelles (Q). *p≤0.05, **p≤0.01, Unpaired t-test.

