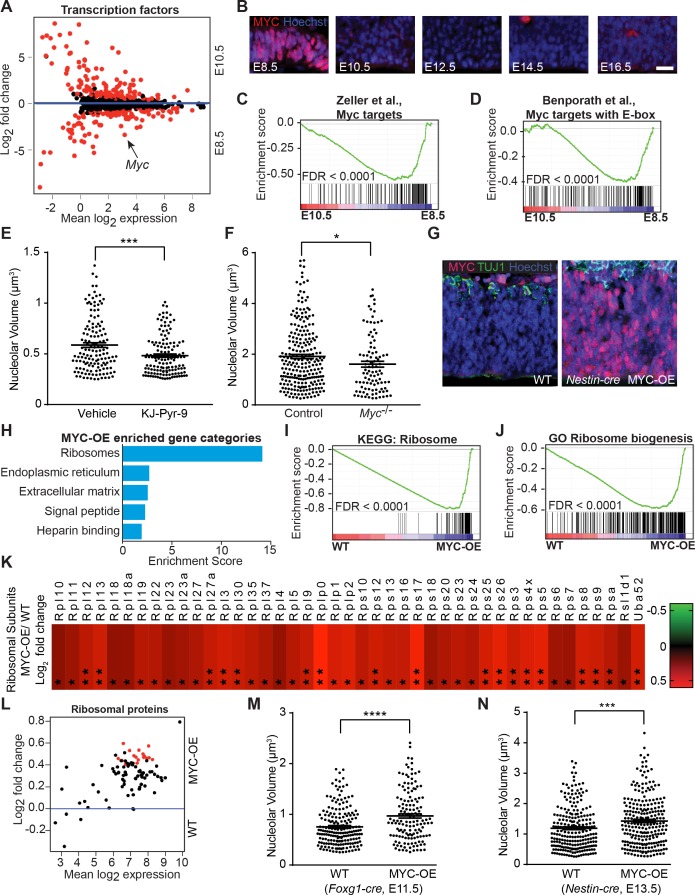
Figure 5. MYC modulates ribosome biogenesis in the developing forebrain.
(A) MA plot displaying genes encoding transcription factors in E8.5 and E10.5 neuroepithelium. Each dot represents a single gene. Red dots denote differentially expressed genes identified by Cuffdiff (q<0.05). Genes below blue line (y = 0) enriched in E8.5. Myc (arrow) expression is ~10 fold higher in E8.5 epithelium (FPKM: E8.5=28.73, E10.5 = 2.76). (B) MYC expression was enriched in E8.5 neuroepithelium. Once downregulated at E10.5, MYC expression remained low throughout cortical development. Scale bar = 20 μm. (C, D) GSEA of E8.5 versus E10.5 neuroepithelium for gene sets containing genes up-regulated by MYC and whose promoters are bound by MYC (C), and E-box containing MYC target genes (D). Broad Institute Molecular Signatures Database Identifiers: DANG_MYC_TARGETS_UP (C), BENPORATH_MYC_TARGETS_WITH _EBOX (D). Each line represents a single gene in the gene set; genes on the right side enriched in E8.5. (E) Quantification of nucleolar volume of E8.5 embryos treated with vehicle control or KJ-Pyr-9 for 24 hr. Each data point represents one nucleolus. ***p≤0.001, Welch’s t-test. Sample size, vehicle: n = 140 from three embryos; KJ-Pyr-9: n = 140 from three embryos. (F) Quantification of nucleolar volume of Myc-/- compared to controls (wild type and heterozygous littermates) in E8.5 neuroepithelium. *p≤0.05 Unpaired t-test. Sample size, controls: n = 238 from five embryos; Myc-/-: n = 97 from two embryos. (G) Immunostaining shows overexpression of MYC (red) in the developing cortex of E12.5 MYC-OE (right) embryos from the Nestin-cre x StopFLMYC cross. TUJ1 (green) staining labels neurons. (H) Functional annotation clustering of the 105 MYC-OE enriched genes shows overrepresentation of genes encoding ribosome constituents. The top five enriched functional clusters are shown. (I, J) GSEA of WT versus MYC-OE apical progenitors for gene sets involved in ribosome biogenesis. Broad Institute Molecular Signatures Database Identifiers: KEGG_RIBOSOME (I), and GO_RIBOSOME_ BIOGENESIS (J). Each line represents a single gene in the gene set, genes on the right side are enriched in MYC-OE. (K) Heatmap of the 43 ribosomal protein genes that are differentially expressed between MYC-OE and WT apical progenitors (* q < 0.3, **q < 0.1). All ribosomal proteins are more highly expressed in MYC-OE. Red and green indicate relatively higher and lower expression, with gene FPKM values log2 transformed. (L) MA plot displaying genes encoding ribosomal proteins in E13.5 apical progenitors. Each dot represents a single gene. Red dots denote differentially expressed genes as identified by Cuffdiff (q<0.1). Genes above blue line (y = 0) are enriched in MYC-OE. (M) Quantification of nucleolar volume of WT and MYC-OE (Foxg1-cre driven) forebrain progenitors at E11.5. Each data point represents one nucleolus. ****p≤0.0001, Welch’s t-test. Sample size, WT: n = 194 from four embryos; MYC-OE: n = 144 from three embryos. (N) Quantification of nucleolar volume of WT and MYC-OE (Nestin-cre driven) apical progenitors at E13.5. Each data point represents one nucleolus. ***p≤0.001, Welch’s t-test. Sample size, WT: n = 234 from five embryos; MYC-OE: n = 248 from five embryos.
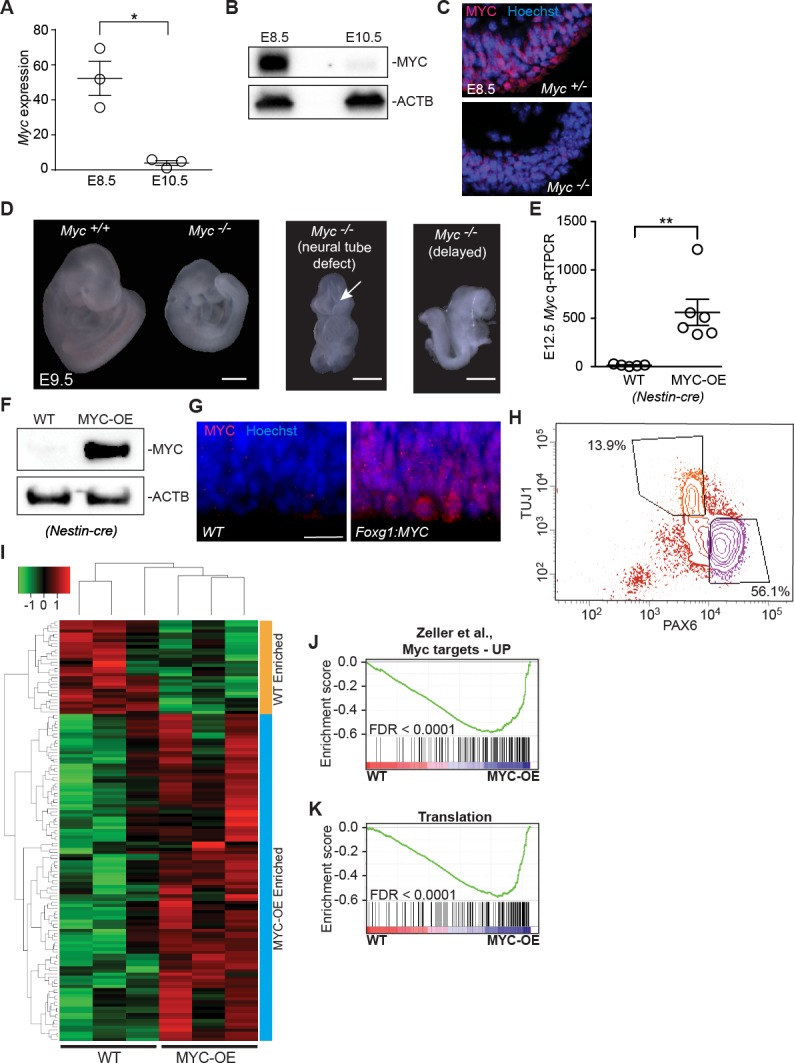
Figure 5—figure supplement 1. MYC expression and mouse models.


