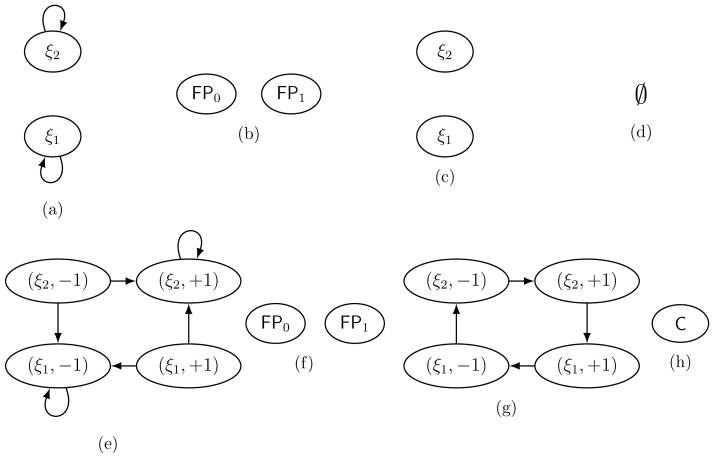
Figure 3.
Domain graphs and Morse graphs for the phase spaces in Figure 2. (a), (b) Domain and Morse graphs for the switching phase space in Figure 2a for the positive self-loop in Figure 1a. (c), (d) Domain and (empty) Morse graphs for the switching phase space in Figure 2c for the negative self-loop in Figure 1c. (e), (f) Domain and Morse graphs for the extended phase space in Figure 2b for the positive feedback in Figure 1b. (g), (h) Domain and Morse graphs for the extended phase space in Figure 2d for the positive feedback in Figure 1d. In all cases, ξ1 is the domain graph node corresponding to the switching domain where y1 < θ1,1, and ξ2 corresponds to y1 > θ1,1.

