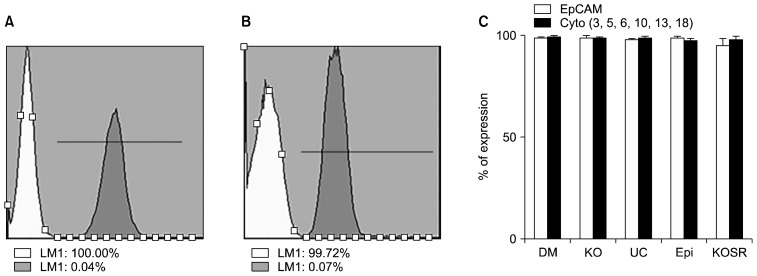
Fig. 2.
Immunophenotyping of AME at P1. A representative histogram of isotypes white and grey as EpCAM (A) and Cyto (B) (Cytokeratin 4, 5, 6, 10, 13, 18) of AME cultured in UC respectively. (C) Overall bar chart of Immunophenotyping of EpCAM and cyto expression of AME in all 5 different cell culture media.

