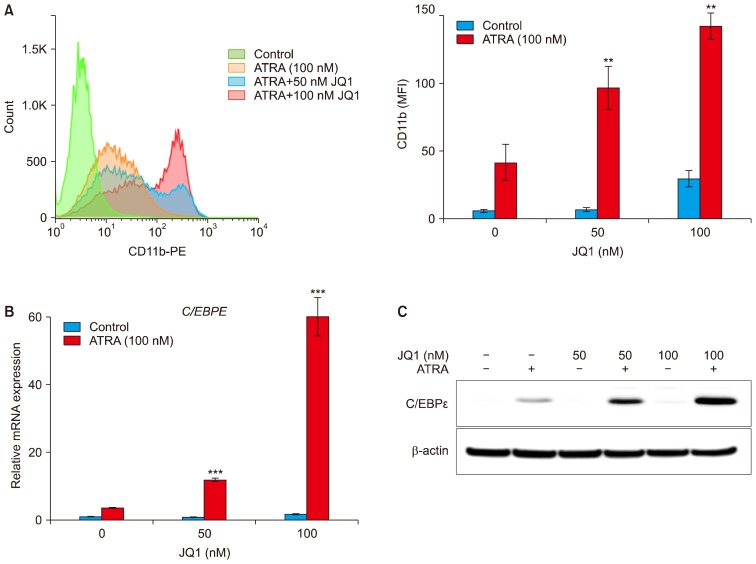
Fig. 2.
Effect of JQ1 on ATRA-induced HL-60 cell differentiation. HL-60 cells were treated with the indicated concentrations of JQ1 and/or 100 nM ATRA for 3 days. (A) Histogram (left) and bar graph (right) represented CD11b expression. Values were expressed as Mean fluorescence of intensity (MFI). Experiments were independently repeated three times and results were shown as mean±SD. (B) The mRNA levels of C/EBPɛ were determined by real-time PCR. The relative expression of C/EBPɛ mRNA was normalized to GAPDH and was reported as a percentage of untreated cells. (C) The protein levels of C/EBPɛ were measured by Western blot analysis using 20 μg protein. Similar results were obtained in three independent experiments. *combination versus ATRA (***p<0.001; **p<0.01).

