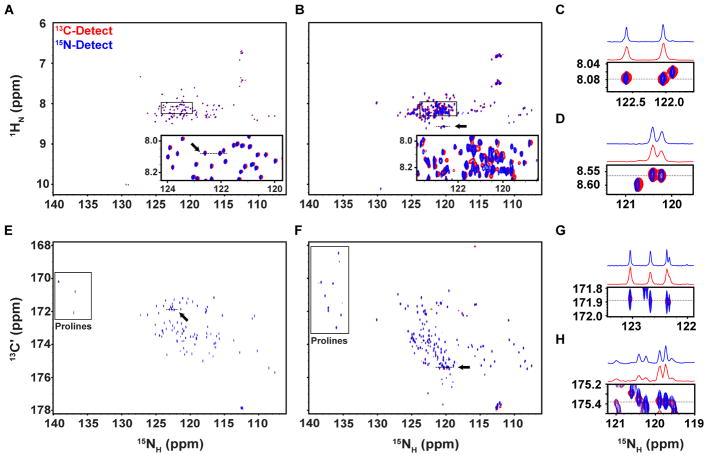
Figure 2.
Comparison of 2D heteronuclear correlation spectra for 13C/15N Hdm2-ABD and 13C/15N Surf6-N. (A) Overlaid 1H- (red) and 15N-detected (blue) 2D 1H-15N correlation spectra for Hdm2-ABD. The boxed region is shown enlarged with contours in the 1H-detected spectrum scaled by 0.5 for clarity (A, inset) (B) Overlaid 1H- (red) and 15N-detected (blue) 2D 1H-15N correlation spectra for Surf6-N. The boxed region is shown enlarged with contours in the 1H-detected spectrum scaled by 0.5 for clarity. Chemical shift perturbations were observed due to sample heating during decoupling (B, inset) (C) Zoomed view of a region from panel A, as indicated by the black arrow, with 1D projections along 8.08 ppm in the 1H dimension (dotted line) highlighting the differences in 15N linewidths. (D) Zoomed view of a region from panel B (black arrow), with 1D projections along 8.57 ppm in the 1H dimension (dotted line) (E) Overlaid 13C- (red) and 15N-detected (blue) 2D 13C’-15N correlation spectra for Hdm2-ABD. (F) Overlaid 13C- (red) and 15N-detected (blue) 2D 13C’-15N correlation spectra for Surf6-N. In panels E and F, proline resonances are denoted by the boxed regions. (G) Zoomed view of a region from panel E (black arrow), with 1D projections along 171.9 ppm in the 13C dimension (dotted line). (H) Zoomed view of a region from panel F (black arrow), with 1D projections along 175.4 ppm in the 13C dimension (dotted line). Axes for 1H and 13 C-detected spectra have been rotated for clarity.

