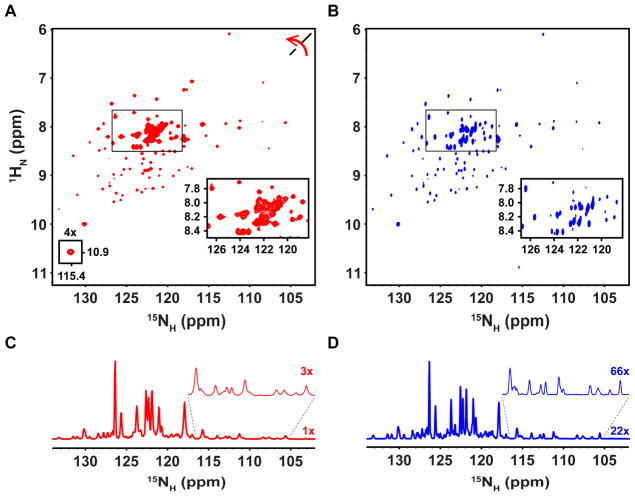
Figure 3.
Comparison of 1H- and 15N-detected TROSY-enhanced 2D 1H-15N correlation spectra for 2H/15N N130. (A) 1H-detected TROSY-enhanced 2D 1H-15N correlation spectrum of N130, where the axes have been rotated for clarity. The small inset reveals a weak resonance (contoured at 4X). (B) 15N-detected TROSY-enhanced 2D 1H-15N correlation spectrum of N130. The boxed regions in (A) and (B) are enlarged in the insets to show spectral regions containing resonances for IDR residues. (C) 1D projection in of 15N dimension of the 1H-detected spectrum in (A) showing 15NH linewidths. The expanded region of the spectrum, which contains pentamerization domain resonances, is scaled 3x for clarity. (D) 1D projection in the 15N dimension of the 15N-detected spectrum in (B) showing 15NH linewidths at a scale of 22x. The expanded region of the spectrum containing pentamerization domain resonances is shown at a scale of 66x for clarity.

