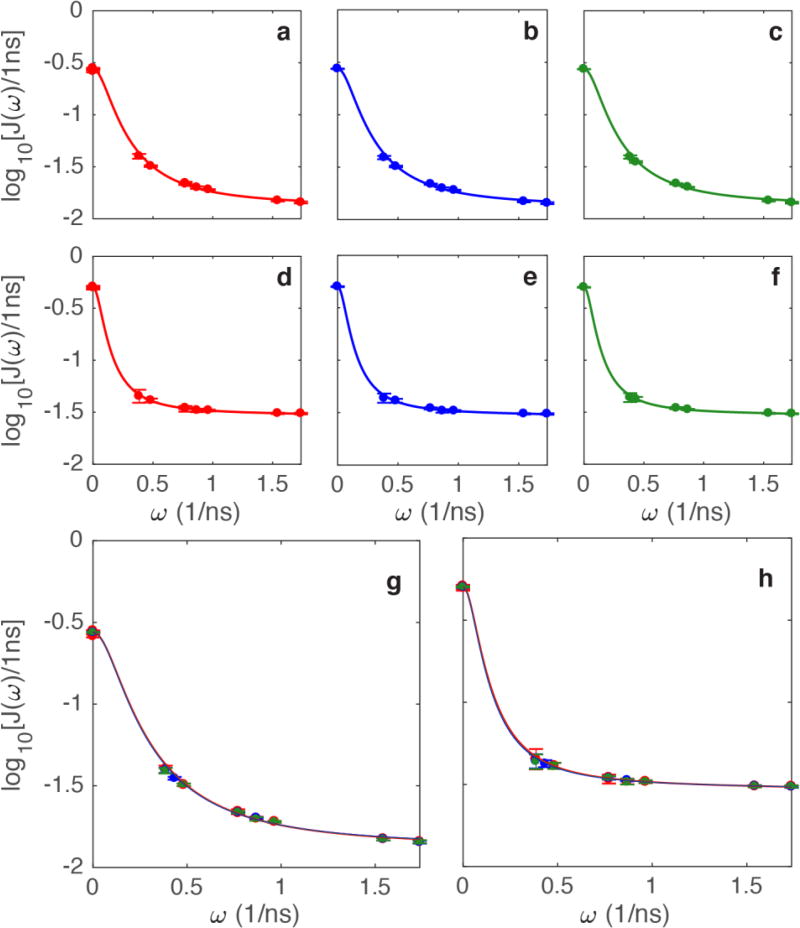
Figure 3.
(a–f) represent the individual fits for (red) independent, (blue) joint, and (green) joint-interpolated). The first row (a–c) shows plots for Val 121 γ2, with each method, plotted individually. The second row (d–f) shows plots for Leu 56 δ1, with each method also plotted individually. Superposition of data and fits for the three methods are shown for (g) Val 121 γ2 and (h) Leu 56 δ1.

