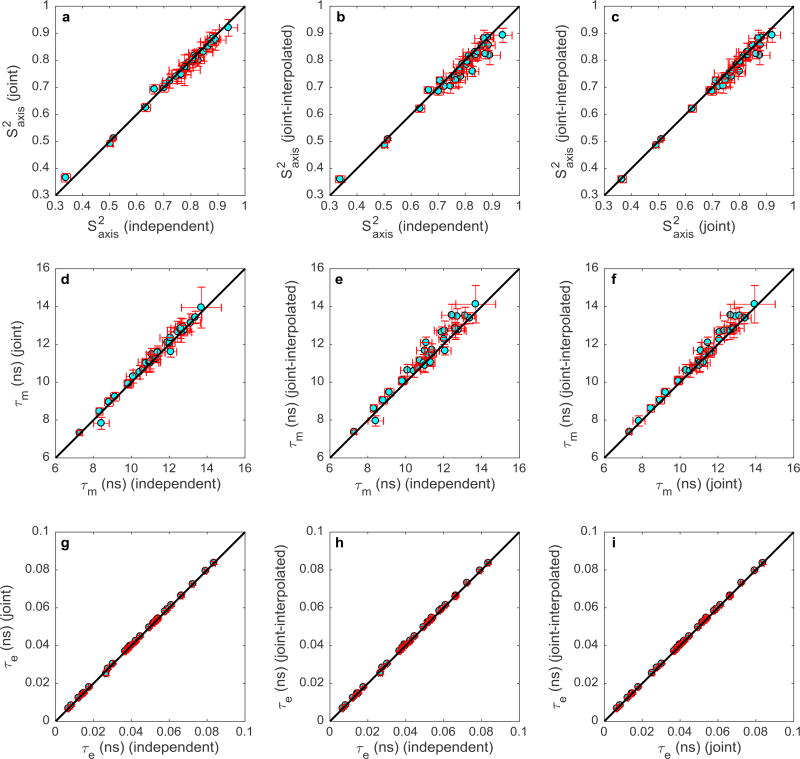
Figure 4.
Correlation plots for (top row a–c), τm (middle row d–f), and τe (bottom row g–i). Each row compares the model free parameters generated from the independent, joint, and joint-interpolated methods. The parameters of the 32 residues are shown in cyan, while the error bars are depicted in red. The black line represents y=x.

