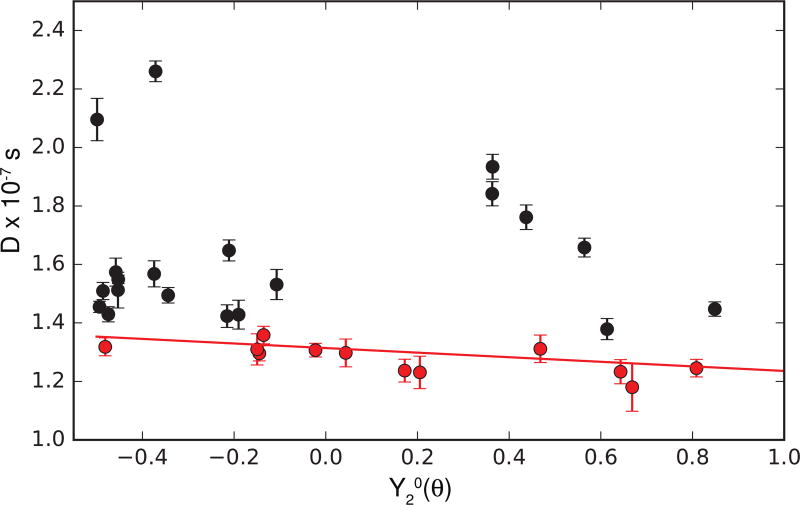
Figure 6.
Local diffusion times (D = 1/(6τm)) plotted versus Y20(θ), in which θ is the orientation of the methyl symmetry axis in the structure of RNase H oriented in the principal axis system of the diffusion tensor determined from 15N spin relaxation. The values of D for the 12 slowest tumbling residues (for which internal motions are well-separated from overall rotation) are shown in red and agree quantitatively with predictions from the overall rotational diffusion tensor determined from 15N relaxation data (red line), when adjusted for the sample temperature and D2O viscosity.

