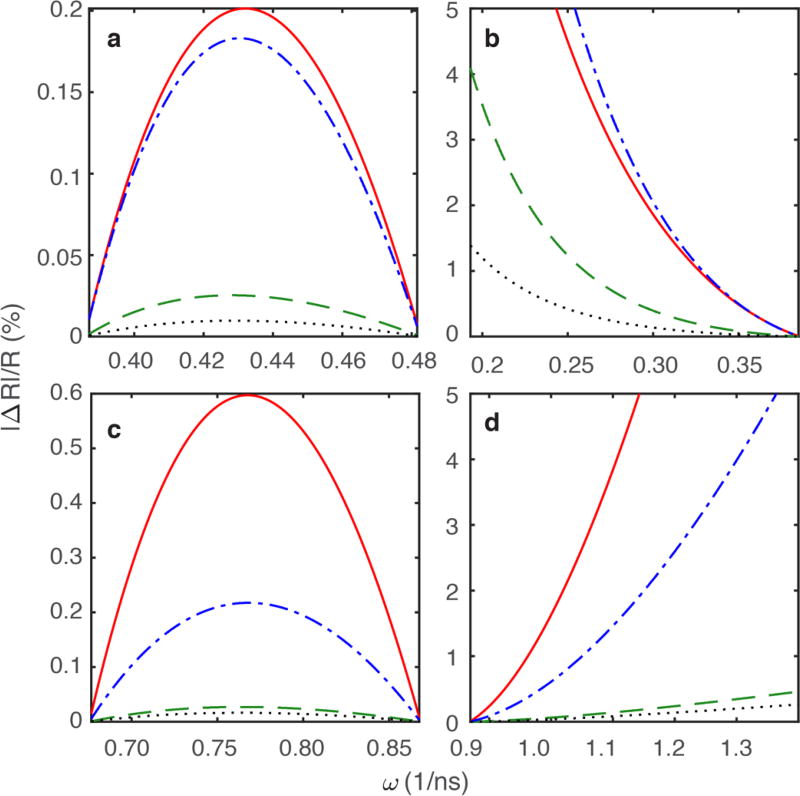
Figure 7.
Predicted errors for Eq. 14 over a range of methyl frequencies ω(1/ns), given set values of methyl axis order parameters of 0.5, overall tumbling time τm of 10 nanoseconds, and effective correlation times τe of 0.3 nanoseconds. The red solid line represents R1, the green dashed line represents R1ρ, the blue dot-dashed line represents RQ, and the black dotted line represents RAP. (a) Interpolated for methyl frequencies between ωD/(2π) = 61.4 MHz – 76.8 MHz. (b) Extrapolated for methyl frequencies below ωD/(2π) = 61.4 MHz using the ωD/(2π) = 61.4 and 76.8 MHz pair of relaxation rate constants. (c) Interpolation for methyl frequencies between ωD/(2π) = 107.4 MHz – 138.2 MHz. (d) Extrapolation above ωD/(2π) = 138.2 MHz for the ωD/(2π) = 107.4 MHz and 138.2 MHz pair of relaxation rate constants.

