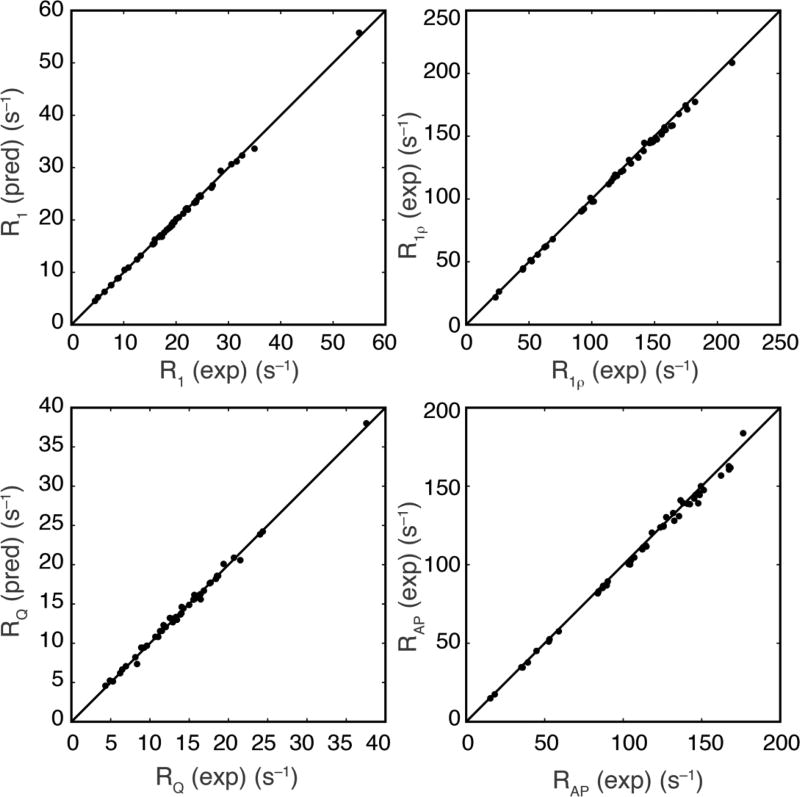
Figure 8.
Comparison of 2H relaxation rate constants (pred) interpolated and (exp) measured at ωD/(2π) = 122.8 MHz. Interpolation was performed using measured values of the relaxation rate constants with ωD/(2π) = 107.4 MHz and 138.2 MHz. For R1, the slope of a line fitted through the origin was 0.997, the root-mean-square (rms) relative variation was 1.0%. The rms relative uncertainty in the measured values was 1.8%. For R1ρ, the slope of a line fitted through the origin was 0.984, the rms relative variation was 1.5%. The rms relative uncertainty in the measured values was 1.6%. For RQ, the slope of a line fitted through the origin was 0.983, the rms relative variation was 2.2%. The rms relative uncertainty in the measured values was 2.7%. For RAP, the slope of a line fitted through the origin was 0.997, the root-mean-square percent variation was 1.9%. The rms relative uncertainty in the measured values was 2.2%. The rms relative variations between predicted and experimental values shown above were divided by 21/2 to allow direct comparison to relative variation in experimental values.

