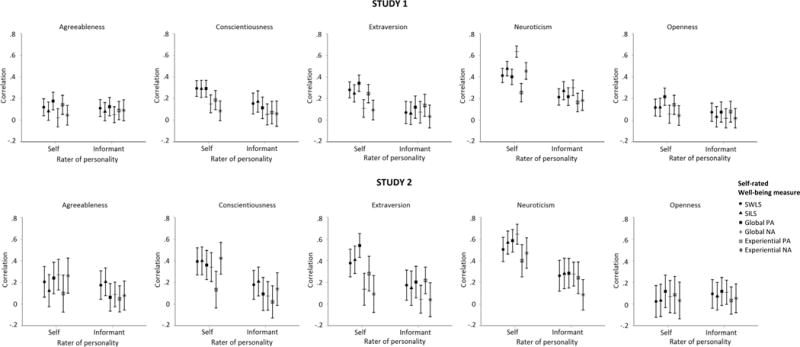
Figure 3.

Absolute correlations between the stable trait component of self-rated well-being variables and self- and informant-ratings of personality. Error bars show 95% confidence intervals around the estimated correlations. Global NA and experiential NA correlated negatively with all personality variables except for Neuroticism, and Neuroticism correlated negatively with all other well-being variables; we reversed these correlations for the ease of comparison. SWLS = satisfaction with life scale; SILS = single item life satisfaction; PA = positive affect; NA = negative affect.
