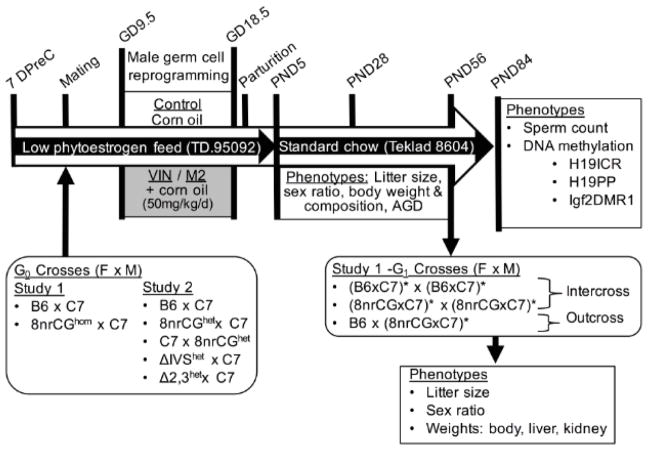
Figure 1.
Treatment Scheme. Illustrates timing of crosses, special diets, experimental treatments, and phenotypes measured. Cross descriptions are shown in order female x male. Homozygous mutant animals are indicated with “hom“, heterozygous mutant animals indicated with “het”. Asterisks (*) indicate which parental G1 animals were exposed to treatments in utero. F, female; M, male; DPreC, days precoitus.

