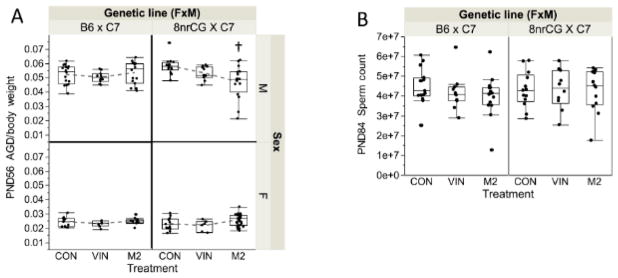
Figure 4.
G1 reproductive development outcomes (Study 1). Box and whiskers plot shown for PND56 (A) male AGD (normalized to body weight, top panel) and female AGD (normalized to body weight, bottom panel); (B) PND84 total sperm count. Error bars indicate standard error of the mean (SEM). Treatment group(s) with a significant difference from CON is denoted by (†). Sample sizes for each treatment group are listed from left to right as shown in each graph (n=number of mice, both sexes combined; N=number of litters): PND56 male AGD/bodyweight n=16, 11, 16, 14, 11, 16; N=5, 4, 5, 6, 3, 6; PND56 female AGD/bodyweight n= 12, 8, 10, 13, 6, 34; N= 5, 4, 5, 5, 3, 7; PND84 sperm count n= 15, 11, 16, 13, 10, 13; N=5, 4, 5, 5, 3, 5).

