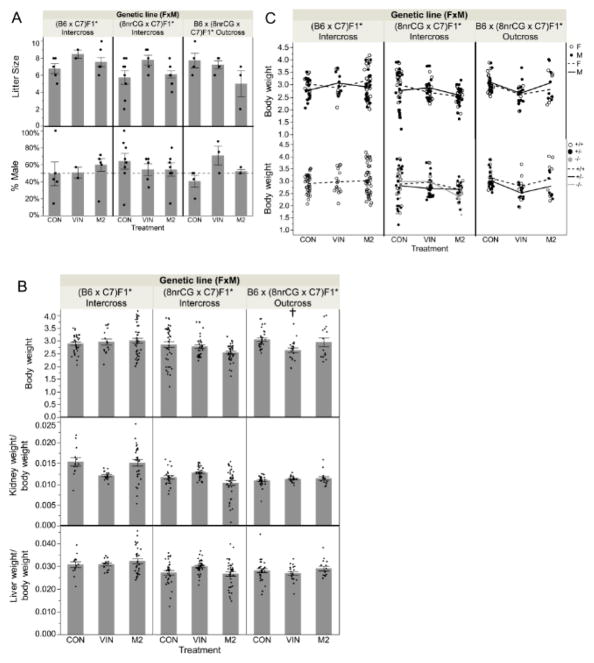
Figure 7.
G2 offspring reproductive and birth outcomes at PND5 (Study 1). Asterisks (*) indicates treated parent(s). (A) Bar graph of average litter size (top panel) and % of litter born male (bottom panel). (B) Bar graph of average body weight (top panel); kidney weight/normalized to body weight (middle panel); and liver weight/normalized to body weight (bottom panel). (C) Samples separated by sex, male (M, filled dots) and female (F, unfilled dots) (top panel); or separated by genotype, wildtype (+/+,unfilled dots), heterozygous mutant (+/−, filled dots), and homozygous mutant (−/−, grey dots) (bottom panel); lines connect means between treatment groups for sexes (top panel) or genotypes (bottom panel). Error bars indicate standard error of the mean (SEM). Treatment group(s) with a significant difference from CON is denoted by (†). Sample sizes for each treatment group are listed from left to right as shown in each graph (n=number of mice, genotypes combined; N=number of litters): Litter size N= 5, 2, 7, 8, 5, 9, 4, 4, 3; % male N= 5, 2, 7, 8, 5, 7, 4, 3, 3; PND5 Body weight n= 32, 16, 44, 40, 36, 43, 31, 20, 15; N= 5, 2, 6, 7, 5, 7, 5, 3, 3 ; PND5 Kidney weight/Body weight n= 13, 16, 32, 23, 36, 36, 31, 20, 15; N= 2, 2, 4, 5, 5, 6, 5, 3, 3; PND5 Liver weight/Body weight n= 13, 16, 32, 32, 36, 37, 31, 20, 15; N=2, 2, 4, 6, 5, 6, 5, 3, 3.

