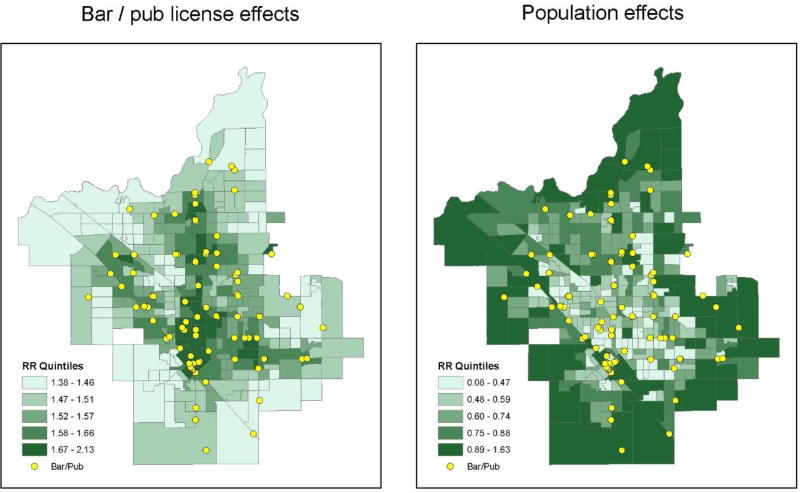
Figure 1.
Estimated contributions of bar densities and population variables to relative rates of had-been drinking (HBD) crashes in Fresno, CA 2008
Note: Each map represents the contribution of the specified community characteristic to the relative risk of HBD crashes within each block group. This combines the characteristics’ impact on the rate of overall injury crashes with their effect on the odds that a crash will be HBD in that area. The left map estimates the combined risk contributions of overall outlet density and proportion bars across three geographic levels (local black group adjacent areas, and ctty-wide). The right map estimates the combined risk contributions of the local populatron density and the adjacent a city-level populations. The color scale for each map identifies quintiles of relative risk within these Fresno block groups. Locations of bars and pubs are shown for reference.

