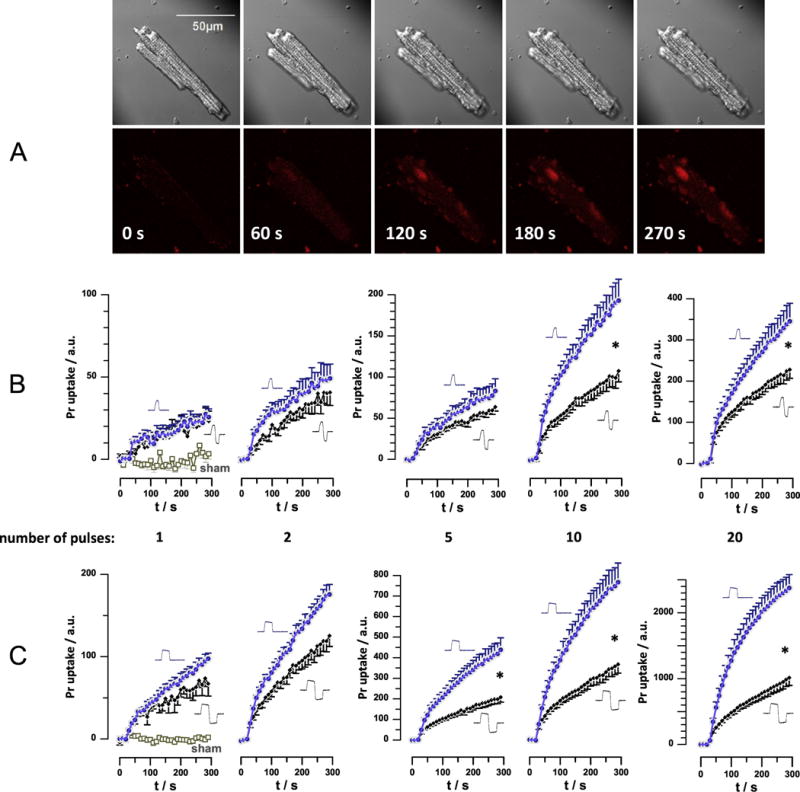
Fig. 4.

Bipolar cancellation of Pr uptake in primary ventricular cardiomyocytes (VCM). A: Representative time lapse images of a mouse VCM exposed to 10, 200-ns unipolar nsEP (30 kV/cm, 5 Hz), starting at 10 s into experiment. Dark shadows in diagonal corners of DIC images (top row) are those of nsEP-delivering electrodes. Bottom row: Pr fluorescence and time stamps. B: Time course of Pr fluorescence in VCM subjected to 200-ns unipolar or 200+200 ns symmetrical bipolar nsEP. The pulse amplitude and delivery rate was kept constant at 800 V (producing 30 kV/cm) and 5 Hz. The number of pulses was varied from 1 to 20 and is indicated under the graphs. The plots for uni- and bipolar pulses are identified by pulse shapes next to the graphs. Data for sham exposure are shown in the left panel only and apply to all experiments. C: same as B, but for 800 ns unipolar and 800+800 ns bipolar nsEP. Mean +/− s.e,, n= 9-11. For clarity, error bars are shown in one direction only; * designates significant difference between uni- and bipolar pulse effects, at p<0.05 or better. Arbitrary units (a.u.) for Pr emission are the same for all panels; note different scales for Y-axes.
