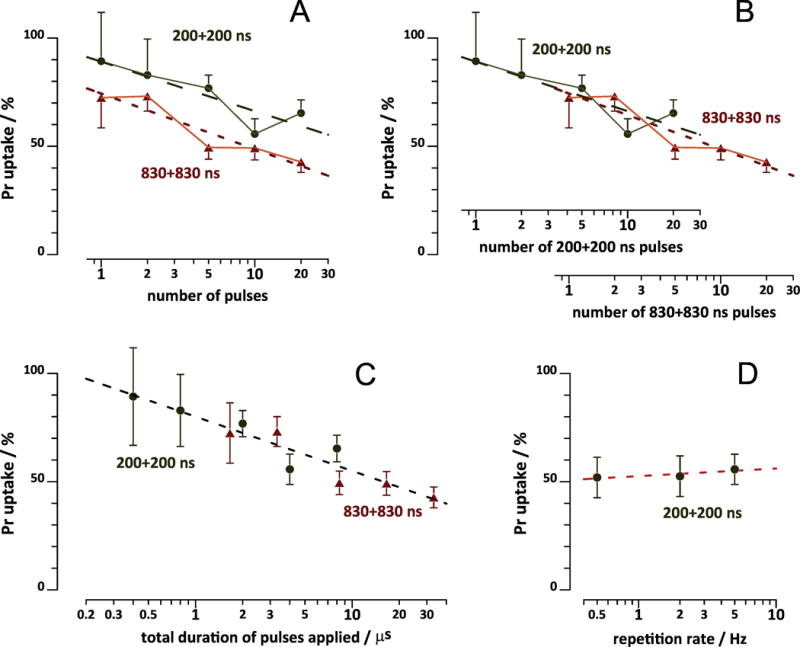
Fig. 5.

Effect of pulse number (A-C) and pulse repetition rate (D) on bipolar cancellation of Pr uptake in VCM. A: Same data as in Fig. 4B and C, but Pr uptake by the end of recording (at 300 s) was plotted against the number of pulses. The effect of the matching unipolar pulse at 300 s was taken as 100%. Dashed lines are the best fit logarithmic functions. B: Same as A, but using different x-axes for longer and shorter bipolar nsEP. The axes were shifted against each other so that one 830+830 ns pulse corresponded to 4.15 of 200+200 ns pulses. C: same as A, but plotting Pr uptake against the cumulative duration of all pulses applied. The dashed line is the best logarithmic fit for both 200+200 ns and 830+830 ns pulse data. See Fig. 4 and text for more details. D: A separate set of experiments, where 10, 30 kV/cm pulses (either unipolar 200 ns or bipolar 200+200 ns) were applied at 0.5; 3; or 5 Hz. Pr emission readings at 300 ns were normalized to the effect of unipolar pulse. Mean +/− s.e., n=5-11.
