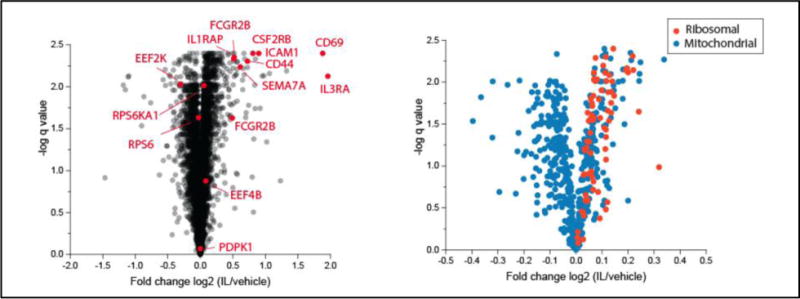
Figure 1. Volcano plots of proteomic changes.

Left, all identified proteins. Right, mitochondrial and ribosomal proteins. IL/vehicle: IL-3-activated versus unactivated EOS. Note that the ranges of horizontal axes are different.

Left, all identified proteins. Right, mitochondrial and ribosomal proteins. IL/vehicle: IL-3-activated versus unactivated EOS. Note that the ranges of horizontal axes are different.