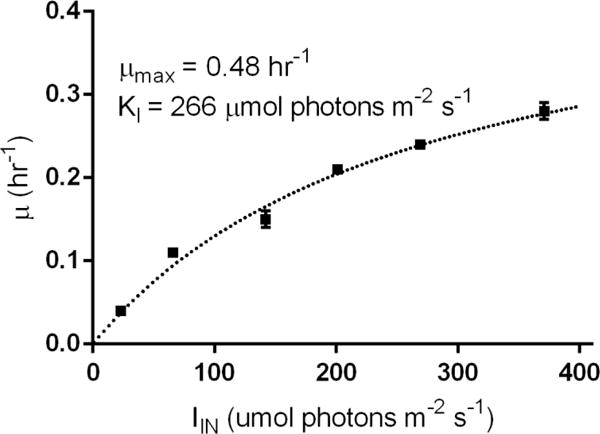
Figure 3.

Monod growth model fit from exponential phase batch cultures of PCC7002. μ values are calculated from the exponential growth rate of cultures grown in the specified IIN with all cell density measurements made at OD730 less than 0.1 to limit the effect of cell shading on IAVG. Error bars represent the standard error of at least three biological replicates.
