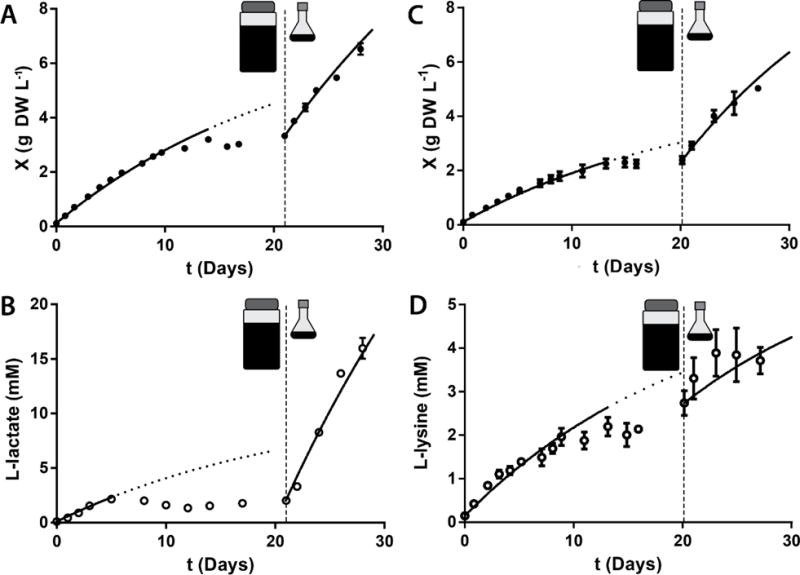
Figure 6.

CC131 growth (A) and L-lactate production (B) and TK.032 growth (C) and L-lysine production (D) were measured in photobioreactors to stationary phase. Subsequently, light limitation was verified by transfer of culture to flasks in which IINSV−1 was significantly higher. Samples were obtained for cell density measurement approximately every 24 hours and L-lactate or L-lysine concentration was determined. The growth retardation phase model was fit to the first 14 days of growth and the first 5 days of L-lactate or L-lysine production after which values deviated significantly from predictions (dotted line). The initial rate method was used to determine η and ρ and then mν was determined using the best fit of Equations 17 and 18. After ~21 days (vertical dashed line), samples from each photobioreactor were transferred to shake flasks. η and ρ were determined for this new growth condition by a best fit of Equations 17 and 18 using the value of mν determined in the photobioreactors. Parameter values are given in Table 4. Error bars represent the standard error of at least two biological replicates. Non-visible error bars are smaller than the data symbol.
