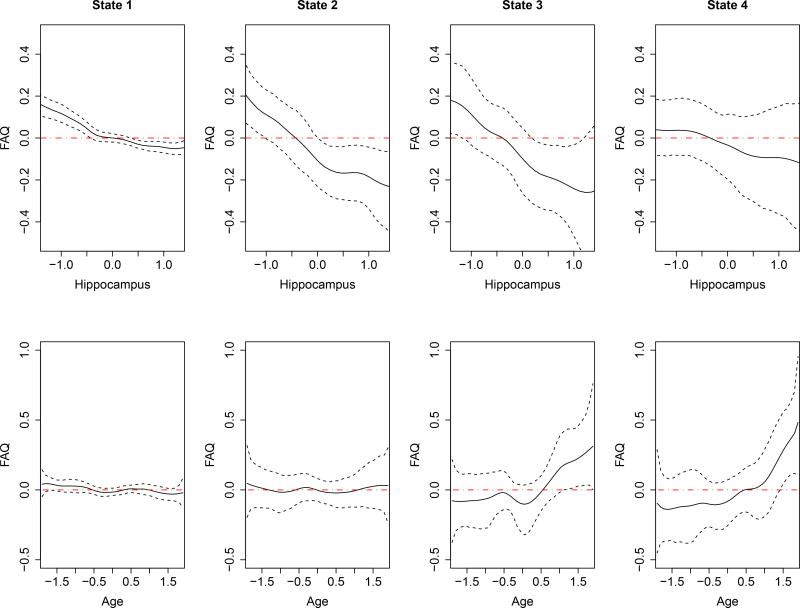
Figure 2.
ADNI-1 data analysis results: estimates of the unknown smooth functions. The solid curves represent the pointwise mean curves, and the dashed curves represent the 2.5%-and 97.5%- pointwise quantiles. line y = 0 has been shown on each picture by red dot-dash to illustrate the range of significant effect for each variable.

