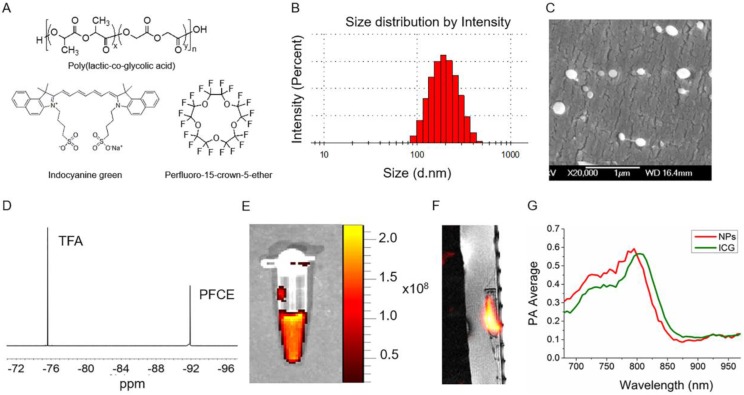
Fig 1.
Nanoparticle characterization. (A) The structures of main components of nanoparticles. (B) Size distribution based on dynamic light scattering measurement (C) Cryogenic Scanning Electron Microscopy (D) 19F NMR spectrum of PLGA-PFCE-ICG nanoparticles in D2O, here Trifluoroacetic acid (TFA) was used as a reference. (E) Fluorescence image of nanoparticles at the concentration of 10 mg/ml. Nanoparticles were excited at 745 nm (F) 19F MR image of 1 mg/ml nanoparticles in a phantom acquired on a clinical scanner (false color). (G) PA spectrum of nanoparticles and free ICG dye measured in vitro.

