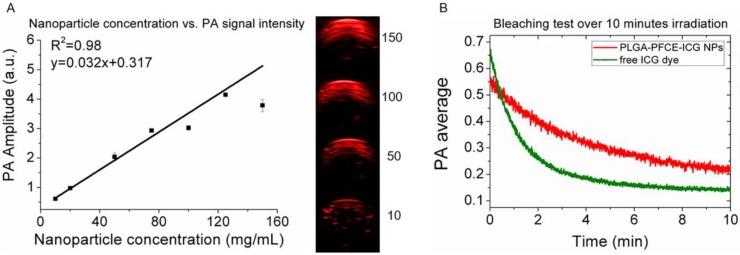
Fig 2.
Influence of nanoparticle concentration and nanoparticle stability for PAI. (A) Graph showing the relationship between PA signal nanoparticle concentration, together with images showing the signal intensity of nanoparticles at various concentrations (mg/mL). The numbers in the panel represent the concentration in mg/mL. (B) Signal stability of PLGA-PFCE-ICG nanoparticles and free ICG dye over 10 minutes of continuous PAI, with the dye at the same concentration in both.

