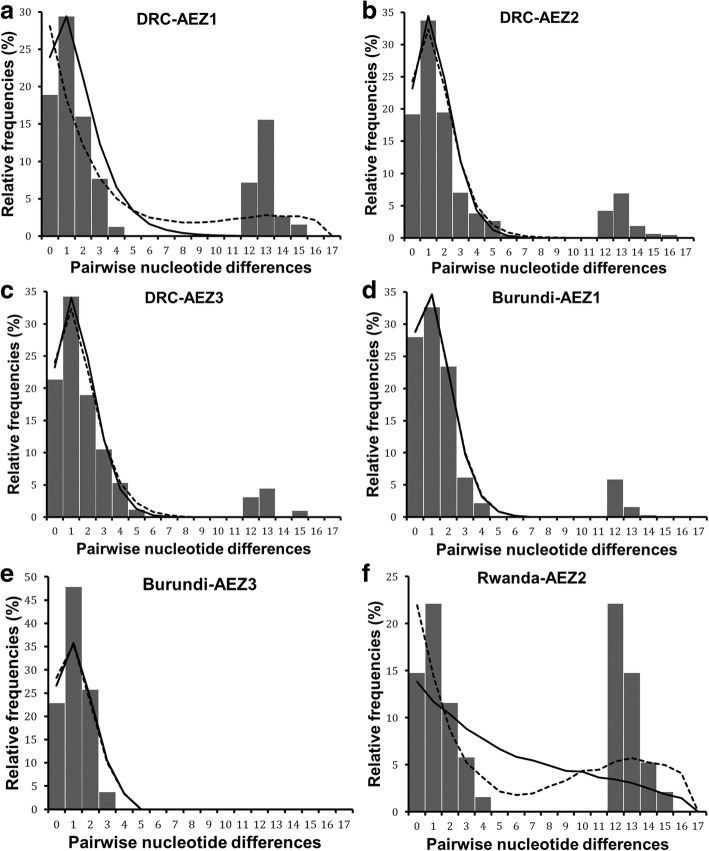
Fig. 6.
cox1 mismatch distribution pattern for six populations of R. appendiculatus. a, b and c show the mismatch distribution pattern for R. appendiculatus from DRC AEZs (AEZ1, 2 and 3, respectively); d and e represent the mismatch pattern of ticks from Burundi AEZ1 and AEZ3, respectively; f depicts the mismatch distribution of ticks from Rwanda AEZ2. The x-axis shows the number of pairwise differences between pairs of haplotype sequences and the y-axis shows their frequencies in %. The observed frequencies are represented by solid histograms. Black full line represents the expected distribution under sudden expansion model, and dotted line represents the distribution simulated under spatial expansion model. Simulated curves under spatial and demographic expansion have same pattern in (d), and they overlapped

