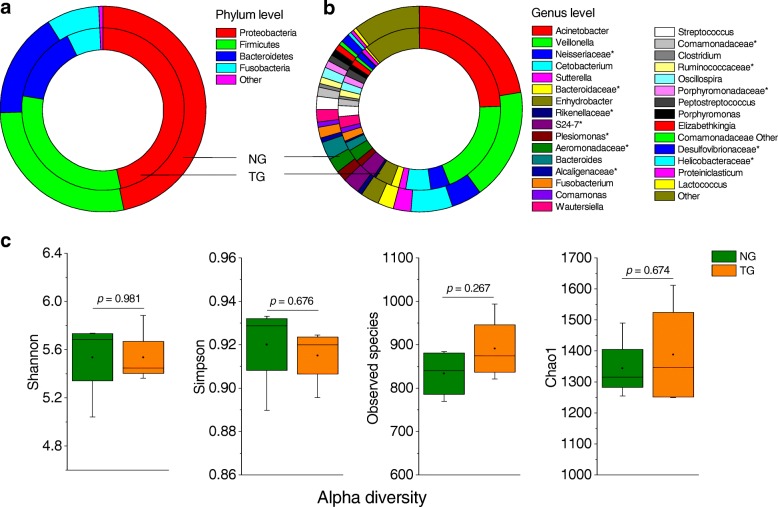
Fig. 1.
Microbial relative abundance and alpha diversity in the food. Microbiota in food, grass carp fillets, fed both the catfish, and mice was assessed. Donut charts of the relative abundance at the a phylum and b genus levels. Outer and inner donuts represent the relative abundance in non-thermally processed and thermally processed grass carp (NG and TG) food, respectively. c Multiple indices for alpha diversity estimation. The symbol “*” denotes unclassified OTUs at a taxonomic higher or lower level

