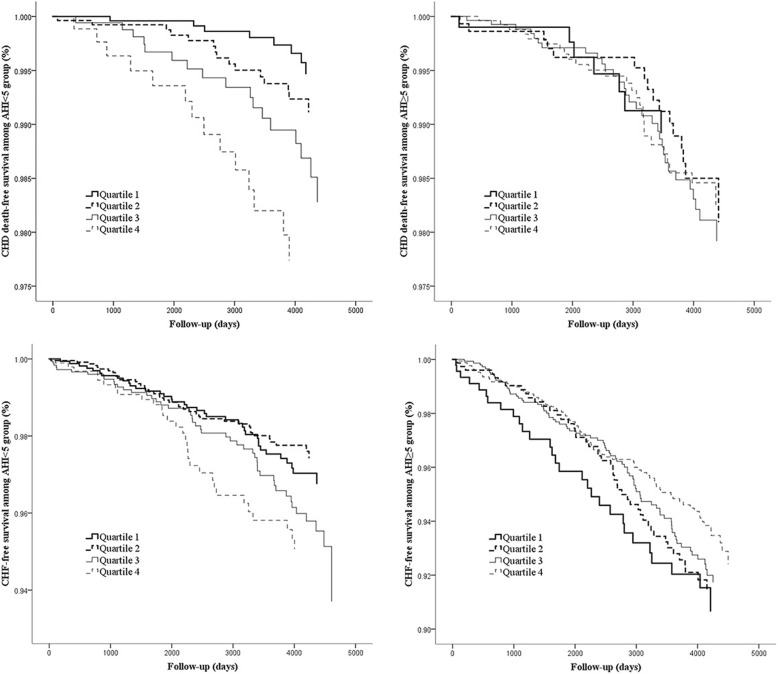
Fig. 1.
Adjusted Kaplan-Meier survival curves for NC quartiles, according to the AHI group and event type. All the results were adjusted for age, sex, BMI, waist circumference, AHI, smoking status, total cholesterol, triglycerides, high-density lipoprotein, history of diabetes, and history of hypertension. CHF = congestive heart failure, CHD = coronary heart disease, AHI = apnoea-hypopnea index, BMI = body mass index, NC = neck circumference

