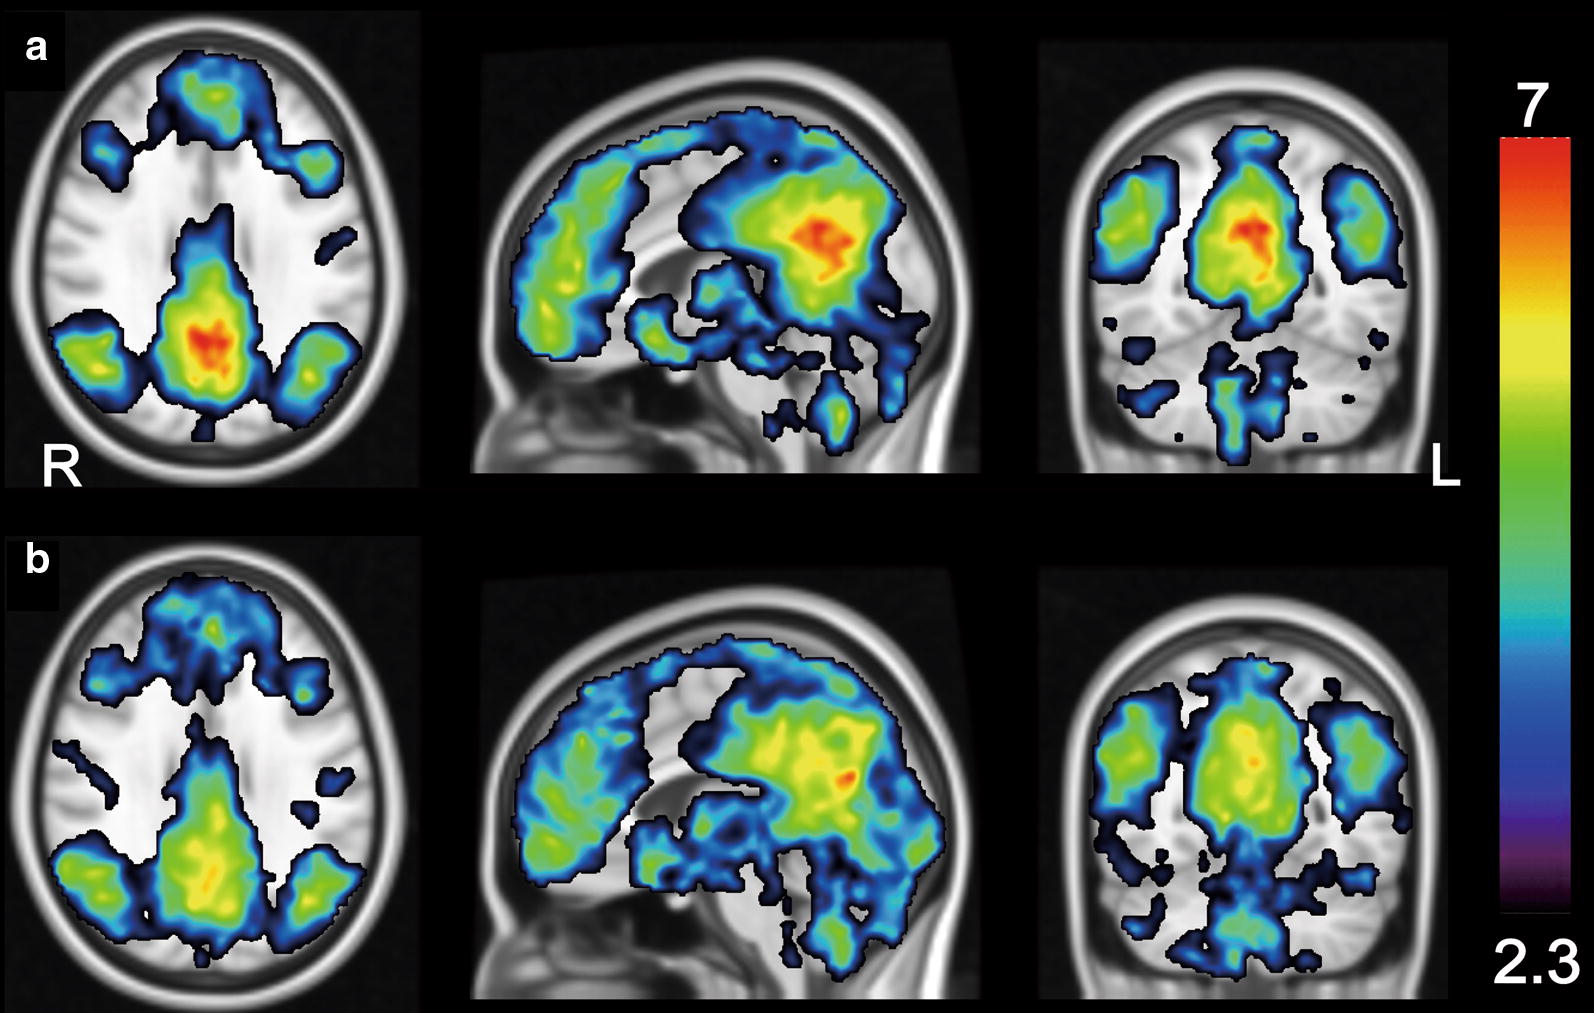
Fig. 3.

Within-group functional connectivity of the DMN using a one-sample t test. A seed was placed on the representative components of the DMN as shown in Fig. 2a. The magnitude of the DMN functional connectivity is displayed in the fasting condition (a) and glucose loading condition (b). The threshold was set at Z > 2.3 and cluster-corrected P < 0.05. The rainbow scale represents the magnitude of the Z values. R right, L left, DMN default mode network
