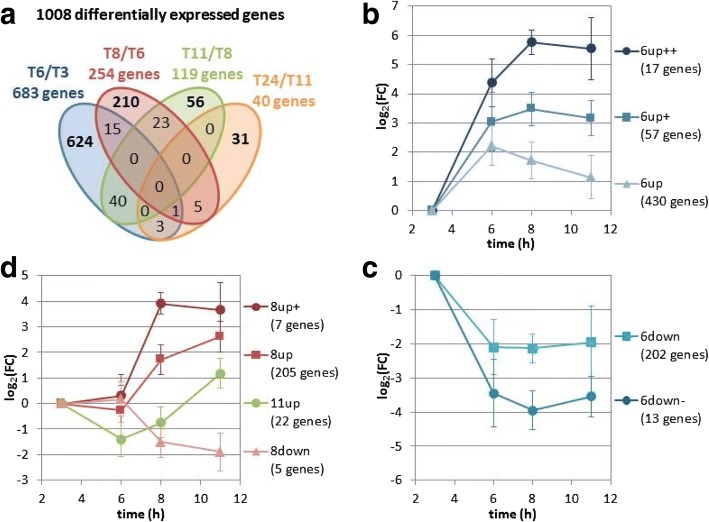
Fig. 3.
Global transcriptomic analysis of C. beijerinckii DSM6423 fermentation on glucose. a Venn Diagram showing the number of genes regulated in various physiological time points. b to d: kinetic expression profiles of various clusters of genes: genes up-regulated at 6 h b, genes down-regulated at 6 h c, and genes regulated at 8 h or 11 h d

