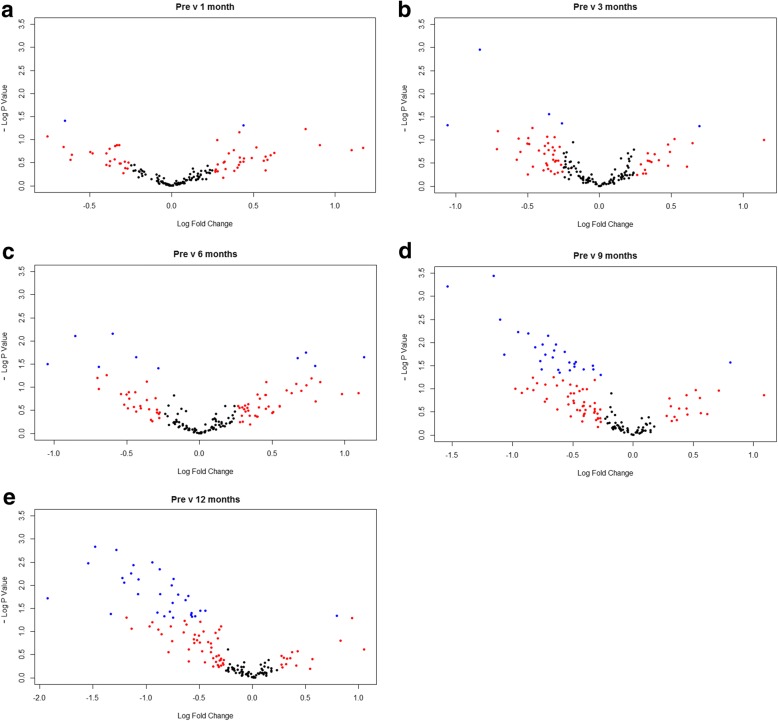
Fig. 2.
Univariate analysis of profiling data presented in volcano plots. Log fold change against -log p value by Student’s t test of postoperative microRNA expression at (a) 1 month, (b) 3 months, (c) 6 months, (d) 9 months and (e) 12 months following RYGB relative to preoperative levels. Each data point represents an individual microRNA that has passed expression threshold. Data points in blue are statistically significant (p < 0.05)

