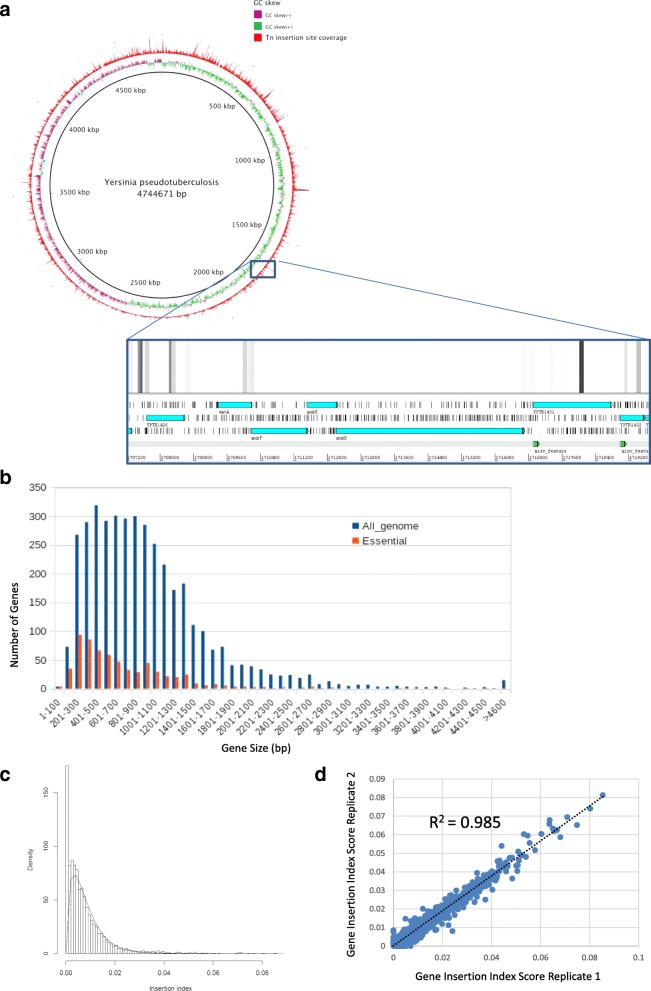
Fig. 1.
a Infographic showing the complete coverage of ~ 40,000 transposon insertions of Tn5 into the Y.pseudotuberculosis chromosome from the pooled TraDIS library. Transposon insertions (RED) occur evenly throughout the genome, with no obvious bias relating to high (GREEN) or low (PURPLE) GC content. Depth of reads are indicated by the height of the bars; gaps in coverage represent the location of essential genes. Inset: presence of essential genes at the muk gene cluster as visualised using Artemis software; heatmap of transposon insertions are mapped against the reference genome. Ring image generated using BRIG Blast Ring Image Generator. b Histogram showing gene-size distribution of the Y. pseudotuberculosis genome alongside gene-size distribution of identified essential genes. c Gamma-curve distribution revealing the insertion-index threshold value at which genes contain no, or very few insertions are considered to be essential. d Correlation coefficient between two technical replicates of TraDIS. Gene insertion index scores for every gene were compared between replicates and plotted; the coefficient score was determined using CORREL function in Microsoft Excel

