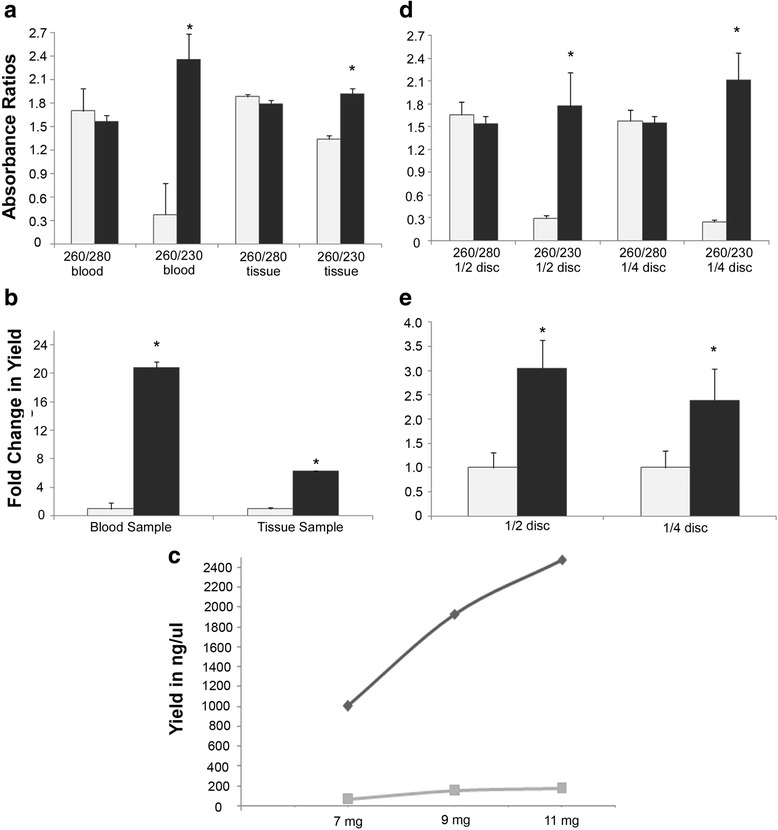
Fig. 2.

Yield and quality of DNA using the old and modified Chelex protocols. Bar graphs representing median values showing the absorbance ratio (a) and yield (b) of DNA obtained from blood and tissue samples. Bar graphs in (d) represent absorbance ratio and in (e) represent yield obtained from half and one fourth of filter paper discs containing the blood sample. White bars represent data obtained by using the old [9] Chelex protocol whereas black bars represent data from the modified Chelex protocol. Error bars represent standard deviations. (c) Minimum quantities of tissue samples utilised for DNA extraction are represented by line graphs wherein the dark gray line represents the yield obtained from the modified method whereas light gray line represents the yield obtained from the old Chelex method
