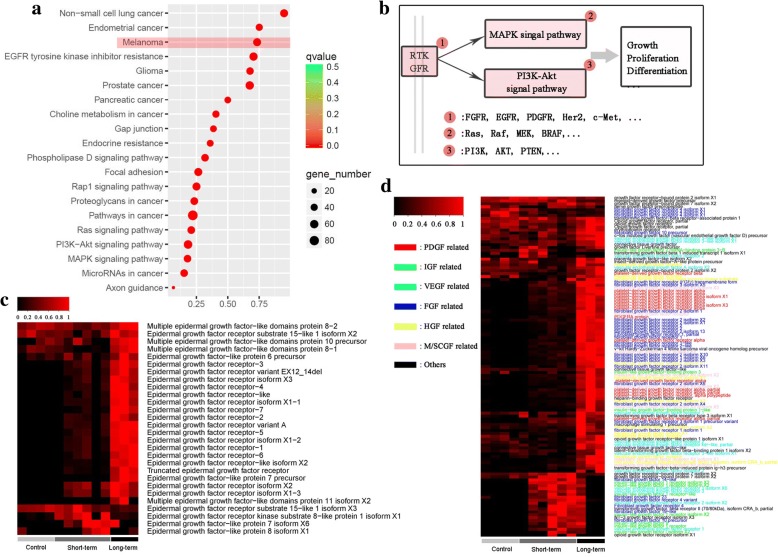
Fig. 4.
Primary transcriptional variations in response to light exposure in O. rhodostigmatus tadpoles. a, Top 20 (sorted by q value) enriched pathways/processes based on core light inducible gene. Rich factor is the ratio between number of gene enriched in a pathway and the total number of genes in this pathway. b, The consensus signal transduction unit among enriched pathways/processes. c, Expression heat map of genes related to epidermal growth factor, expression level was scaled to 0–1. d, Expression heat map of genes related to other growth factors, expression level was scaled to 0–1

