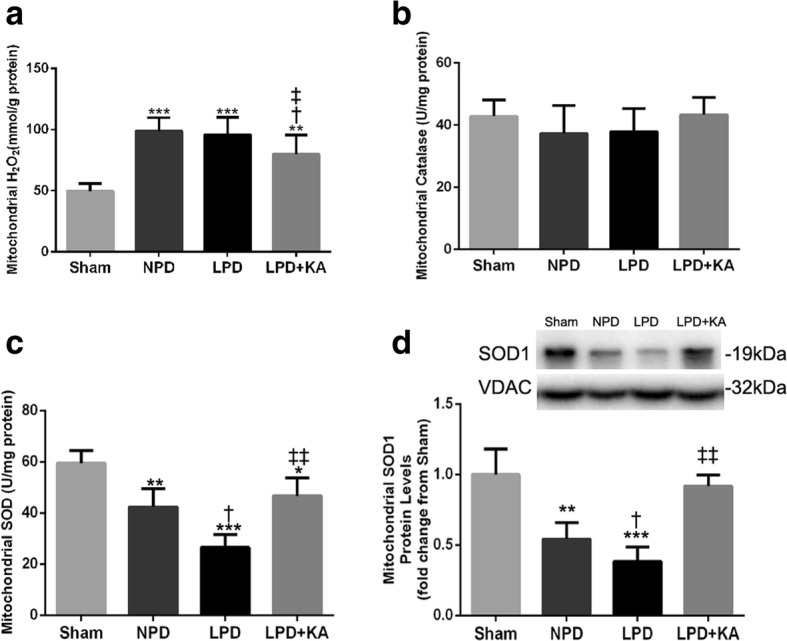
Fig. 4.

Mitochondrial oxidative capacity in skeletal muscle of the experimental groups. a Mitochondrial H2O2 content, b mitochondrial catalase activity, c mitochondrial SOD activity and d mitochondrial SOD1 protein. Results are presented as the mean ± SD, n = 6 per group. Mean value was significantly different from that of the sham group: *P < 0.05, **P < 0.01. Mean value was significantly different from that of the NPD group: †P < 0.05, ††P < 0.01. Mean value was significantly different from that of the LPD group: ‡P < 0.05. Sham, normal-protein diet; NPD, normal-protein diet; LPD, low-protein diet; LPD + KA, low-protein diet supplemented with ketoacids
