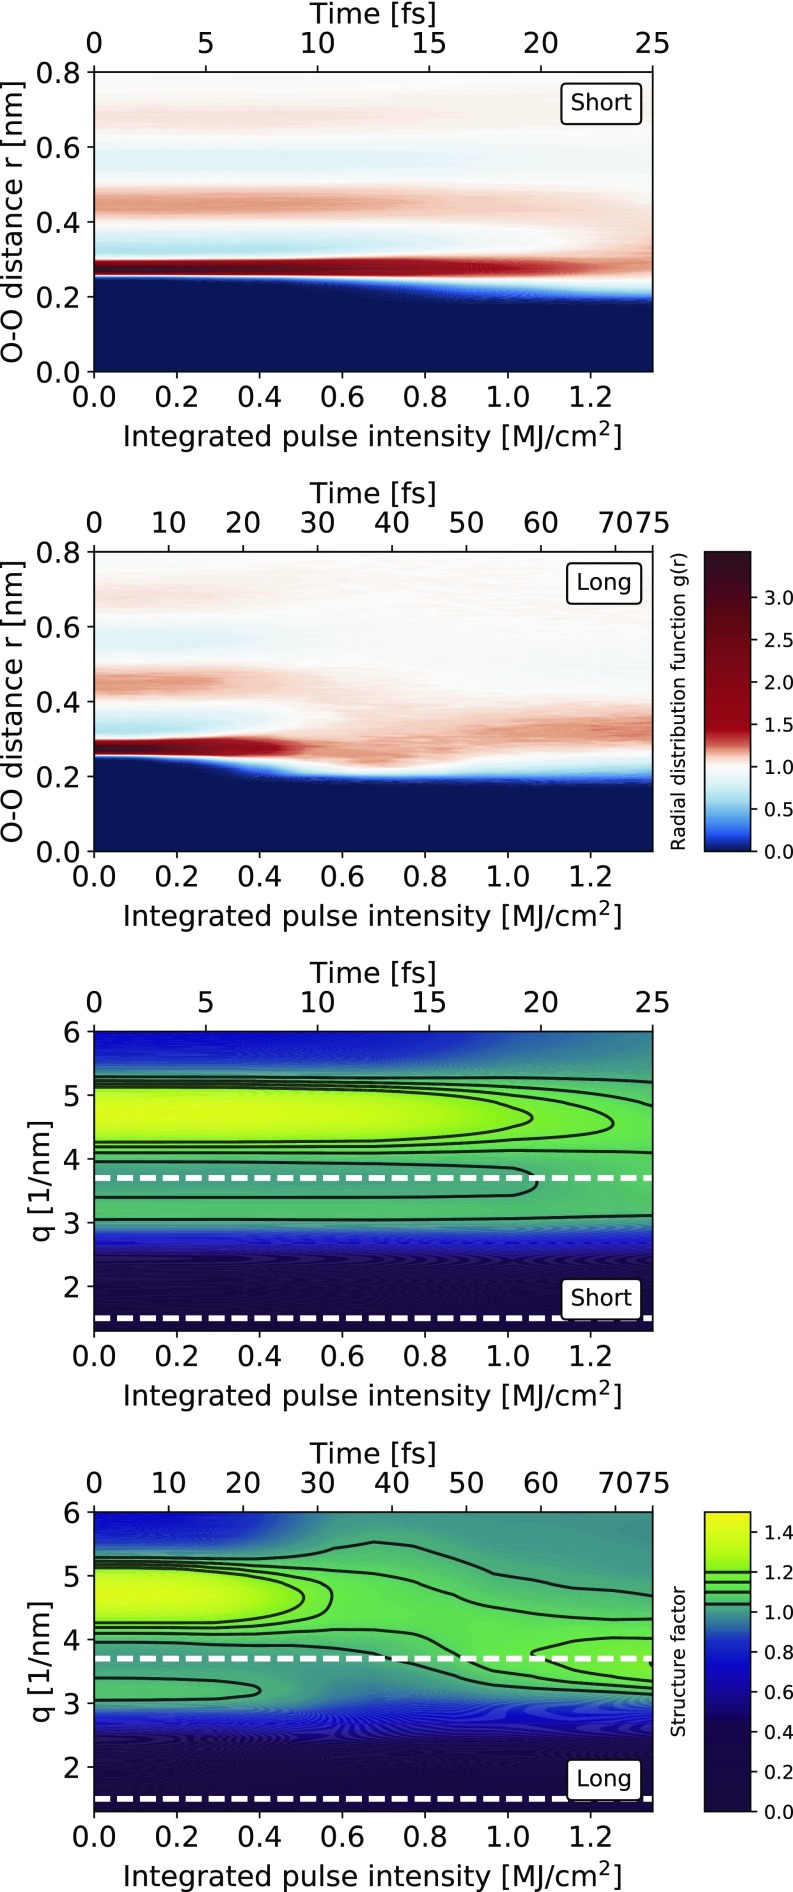
Fig. 5.
Simulation of the time evolution of the RDF and structure factors. (Top and Upper Middle) Time evolution of the RDF during the X-ray pulse, shown as a function of integrated intensity for the two pulses. The short (25 fs) and long (75 fs) pulses have the same total intensity. In both cases, the structure of water does not appear to change until roughly 20 fs. (Lower Middle and Bottom) Time evolution of the structure factor, calculated from the RDF above. The experimental measurements displayed in Fig. 2 were made from to nm−1, marked here with dashed white lines.

