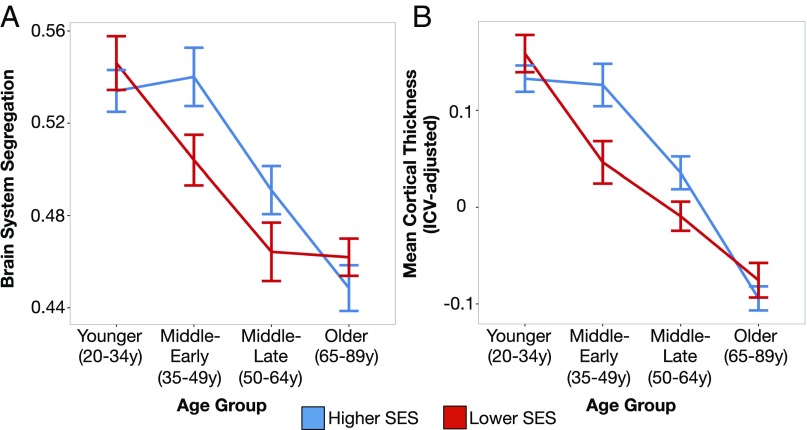
Fig. 2.
Lower SES adults exhibit reduced segregation of their resting-state functional brain networks and lower mean cortical thickness in middle-age adulthood. For each age group, brain system segregation (A) and mean cortical thickness (B) are plotted for higher and lower SES (stratified using a median split across the entire participant sample; error bars depict standard error of the mean). Higher SES is associated with greater brain system segregation and mean cortical thickness in middle-age groups (ME, 35–49 y; ML, 50–64 y). Primary statistical models were completed using general linear modeling, where SES was modeled continuously (see SES Moderates Age-Related Differences in Functional Network Organization and SES Moderates Differences in Brain Anatomy Across Age Groups for details).

