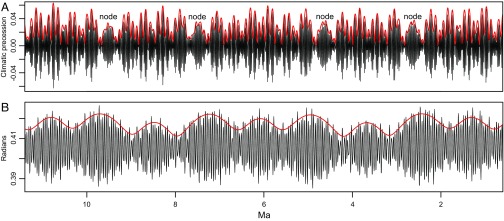
Fig. 1.
Illustrations of Milankovitch grand cycles over the past 1–11 My generated from the astronomical solution in ref. 9. (A) Amplitude modulation of precession by eccentricity. The black line is the climatic precession [= eccentricity × sin(precession angle)]; the red line is the amplitude modulation and reveals cycles at ∼100,000 and ∼405,000 y and grand cycle nodes at ∼2.4 My. (B) Amplitude modulation of obliquity. The black line is the obliquity solution; the red line is the amplitude modulation of the dominant 41,000-y obliquity cycle, with a conspicuous ∼1.2-My grand cycle.

