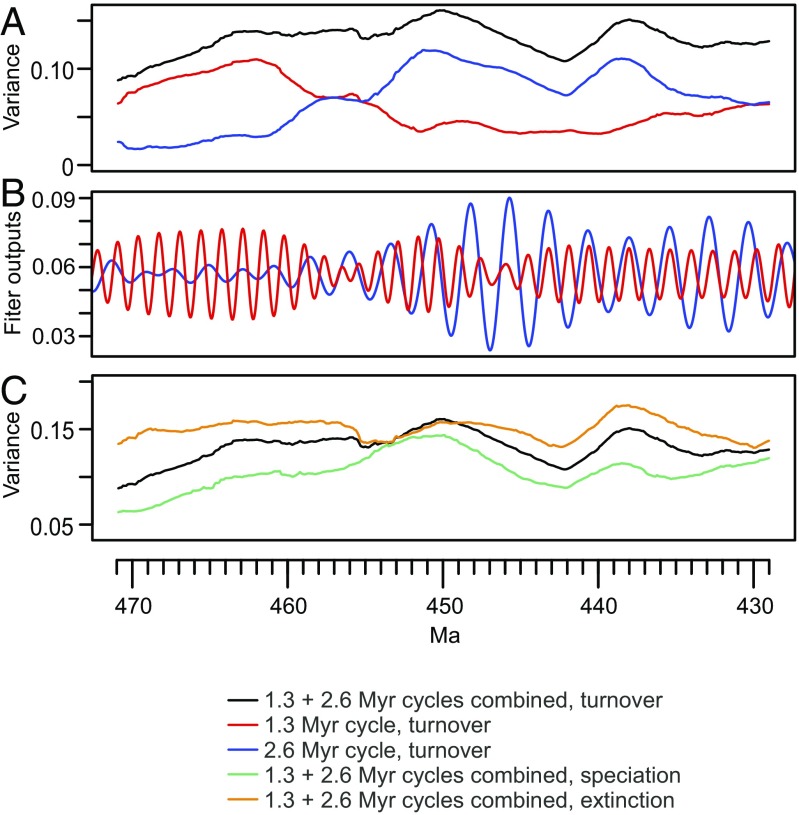
Fig. 3.
Temporal evolution of the observed ∼1.3- and ∼2.6-My cycles in graptoloid HMM species turnover, speciation, and extinction. (A) Proportion of variance associated with the ∼1.3- and ∼2.6-My cycles individually and combined for the default species turnover probability time series used in Fig. 2 C and D. Proportion determined by integration of the EPSA results (Fig. 2D) from 0.21 to 0.52 cycles per 1 My (∼1.3-My cycle) and from 0.53 to 0.90 cycles per 1 My (∼2.6-My cycle). (B) The ∼1.3-My (red) and ∼2.6-My (blue) filtered signals for species turnover determined using the Taner method (19) (compare with Fig. 2C). (C) Proportion of variance associated with the combined ∼1.3- and ∼2.6-My cycles for turnover as in A compared with the same proportions for the component HMM speciation and extinction time series (i.e., those illustrated in Fig. 4 C and F; corresponding EPSA results are shown in Fig. S5 D and E).

