Fig. 5.
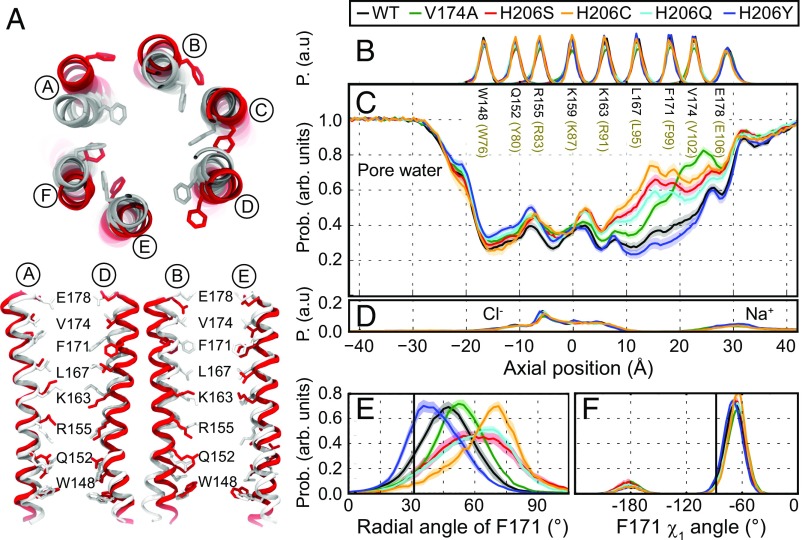
MD simulations demonstrate increased pore helix rotation and pore hydration in GOF mutations H206S/C. (A) Superposition of snapshots at t = 350 ns from MD simulations of WT (gray) and H206S (red) as viewed from the top. (Bottom) Pairs of diagonal subunits viewed from the side. (B) Distributions of the axial position of Cα atoms for all pore-lining residues. The residues corresponding to human Orai1 are shown in brown. Data in A–F were computed from simulations of WT (black) and of V174A (green), H206C (orange), H206S (red), H206Q (aqua), and H206Y (navy) mutant channels. Average distribution of water oxygen atoms (C) and Na+ and Cl− ions (D) along the pore axis. The water occupancies of V174A and H206S/C/Q mutants deviate from those of WT and H206Y dOrai most significantly in the hydrophobic stretch of the pore. Bound Cl− and Na+ counter ions are found in the basic region of the inner pore and near E178 side chains, respectively. (E) Average distribution of the radial angle of residue 171 defined as the angle between the pore axis, the center of mass of the two helical turns centered at residue 171, and the Cα atom of residue 171. The means of these distributions over all simulation repeats in degrees are 47 ± 1° for WT, 53 ± 1° for V174A, 61 ± 1° for H206S, 65 ± 2° for H206C, 59 ± 1° for H206Q, and 42 ± 1° for H206Y. The radial angle in the crystallographic structure (31°) is shown as a black vertical bar for reference. (F) Average distribution of side-chain torsion χ1 of residue 171 in WT and V174A and H206S/C/Q/Y mutants. The χ1 of residue 171 in the crystallographic structure (−88°) is shown as a black vertical bar for reference. The traces depict values ± SEM.

