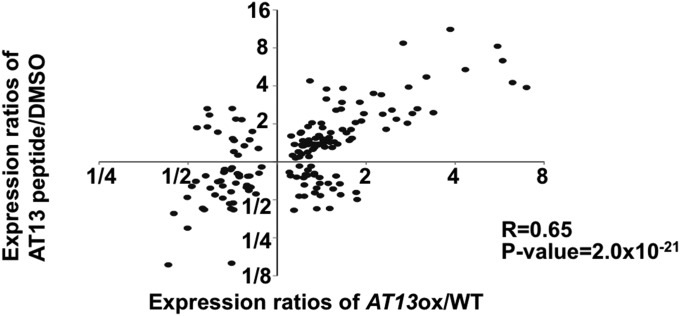
Fig. 4.
Comparison of gene expression in AtPROPEP3/AT13-ox and WT plants treated with the AT13-5 peptide. Log values of gene expression ratios of AtPROPEP3/AT13-ox and AT13-5 peptide-treated plants were plotted. Vertical and horizontal plots indicate alterations in gene expression patterns in AtPROPEP3/AT13-ox and AT13-5 peptide-treated plants, respectively.

